
Dogecoin Price Forecast: DOGE tests a key make-or-break point amid waning retail support
작성자 Vishal Dixit
수정됨: 24 Jun 2026


인기 기사

Dogecoin (DOGE) trades below $0.08000 on Wednesday, maintaining a steady decline for the seventh straight week, with a 4% drop the previous day.
- Dogecoin hovers above a key support of $0.0776, following a 4% decline the previous day.
- DOGE futures Open Interest is down 10% in 24 hours amid negative funding rates, suggesting waning retail demand.
- The technical outlook for DOGE highlights a bullish RSI divergence near $0.0776, suggesting a potential rebound.
Dogecoin (DOGE) trades below $0.08000 on Wednesday, maintaining a steady decline for the seventh straight week, with a 4% drop the previous day. The meme coin is losing its retail strength as DOGE futures Open Interest drops 10% in 24 hours, while institutional demand remains muted with zero inflows so far this week.
From a technical standpoint, DOGE nears a make-or-break point near its June 6 low of $0.0776 with the Relative Strength Index flashing a bullish divergence.
Dogecoin loses its grip on retail demand
Dogecoin is losing demand in the retail space as broader market risk-off sentiment intensifies, with Bitcoin (BTC) closing in on $60,000. CoinGlass data shows a 10% drop in DOGE futures Open Interest to $1.05 billion over the last 24 hours, indicating a sharp decline in positional buildup. At the same time, the funding rate has dipped to 0.0025%, suggesting that traders are willing to buy a short position for a premium, anticipating further downside in the meme coin.
Notably, $6.85 million in total liquidations in DOGE futures over 24 hours was primarily driven by $6.74 million in long liquidations, indicating a clear sell-side bias among traders.

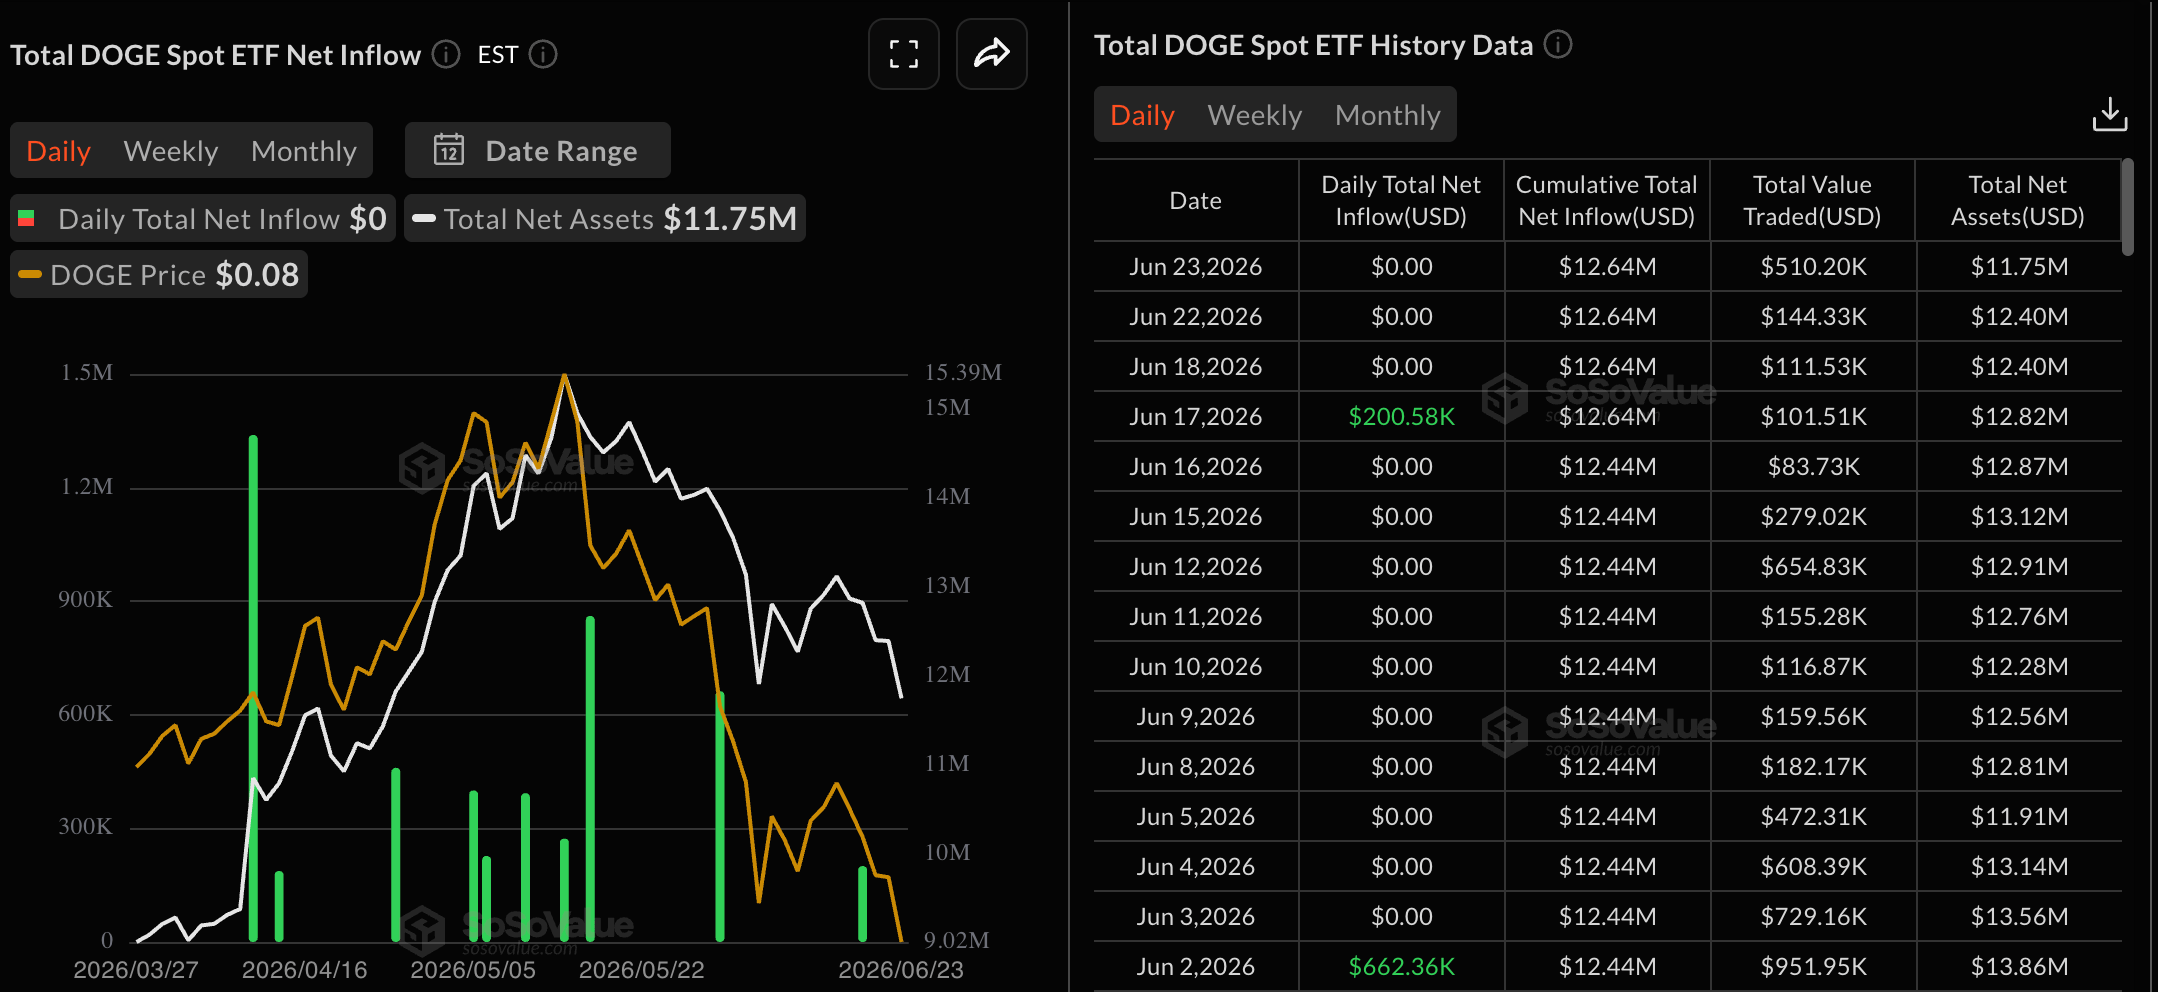
On the institutional side, the DOGE-focused Exchange Traded Funds (ETFs) recorded their third consecutive day of zero inflows on Tuesday, suggesting muted demand from large-wallet investors.
Could Dogecoin defend its line in the sand?
Dogecoin hovers below $0.0800 on Wednesday, maintaining a bearish bias below the 50-day Exponential Moving Average (EMA) at $0.0919 and the 200-day EMA at $0.1154. From a technical perspective, the meme coin remains capped below a descending trendline connecting the May 14 and June 15 highs near $0.0850, reaffirming the bearish bias.
That said, the Relative Strength Index (RSI) at around 28 still lingers in oversold territory, but points to a bullish divergence compared to its June 6 low near 20. Typically, a bullish divergence in the oversold region implies a potential rebound. Still, the Moving Average Convergence Divergence (MACD) is sinking below its signal line, reinforcing the notion of a weak, corrective tone rather than a sustained bullish reversal.
On the downside, initial support is set at $0.0776, with additional cushions at $0.0700 and $0.0641 if selling resumes.
On the topside, a recovery would first need to clear the trendline resistance around $0.0851, before challenging the 50-day EMA at $0.0919 and the horizontal barrier at $0.1000.
(The technical analysis of this story was written with the help of an AI tool.)
Cryptocurrency metrics FAQs
The developer or creator of each cryptocurrency decides on the total number of tokens that can be minted or issued. Only a certain number of these assets can be minted by mining, staking or other mechanisms. This is defined by the algorithm of the underlying blockchain technology. On the other hand, circulating supply can also be decreased via actions such as burning tokens, or mistakenly sending assets to addresses of other incompatible blockchains.
Market capitalization is the result of multiplying the circulating supply of a certain asset by the asset’s current market value.
Trading volume refers to the total number of tokens for a specific asset that has been transacted or exchanged between buyers and sellers within set trading hours, for example, 24 hours. It is used to gauge market sentiment, this metric combines all volumes on centralized exchanges and decentralized exchanges. Increasing trading volume often denotes the demand for a certain asset as more people are buying and selling the cryptocurrency.
Funding rates are a concept designed to encourage traders to take positions and ensure perpetual contract prices match spot markets. It defines a mechanism by exchanges to ensure that future prices and index prices periodic payments regularly converge. When the funding rate is positive, the price of the perpetual contract is higher than the mark price. This means traders who are bullish and have opened long positions pay traders who are in short positions. On the other hand, a negative funding rate means perpetual prices are below the mark price, and hence traders with short positions pay traders who have opened long positions.

100만 명이 넘는 사용자가 FXStreet를 통해 실시간 시장 데이터, 차트 도구, 전문가 인사이트, 포렉스 뉴스를 이용합니다. 포괄적인 경제 캘린더와 교육 웨비나는 트레이더가 정보를 유지하고 신중한 결정을 내리도록 돕습니다. FXStreet는 바르셀로나 본사와 전 세계 지역에 걸쳐 약 60명의 팀으로 구성되어 있습니다.
더 읽기


