
Dogecoin vs Shiba Inu: DOGE and SHIB start July with similar setups
작성자 John Isige
수정됨: 1 Jul 2026


인기 기사

The cryptocurrency market shows subtle signs of rebounding on Wednesday after facing intense headwinds over the past few weeks, largely attributed to geopolitical tensions, macroeconomic uncertainty and risk-averse sentiment.
- Dogecoin tests its recovery potential above $0.0700 support, but upside remains largely limited below major moving averages.
- Shiba Inu’s mild rebound on Wednesday builds on support at $0.0000040, supported by rising momentum indicators.
- Dogecoin’s steady futures Open Interest raises recovery probability, while Shiba Inu’s cooling retail demand may lag trend reversal.
The cryptocurrency market shows subtle signs of rebounding on Wednesday after facing intense headwinds over the past few weeks, largely attributed to geopolitical tensions, macroeconomic uncertainty and risk-averse sentiment. Dogecoin (DOGE) and Shiba Inu (SHIB) are holding above pivotal support levels at $0.0700 and $0.0000040, respectively, suggesting investors are ready to reengage.
DOGE, SHIB derivatives signal caution as risk-off mood lingers
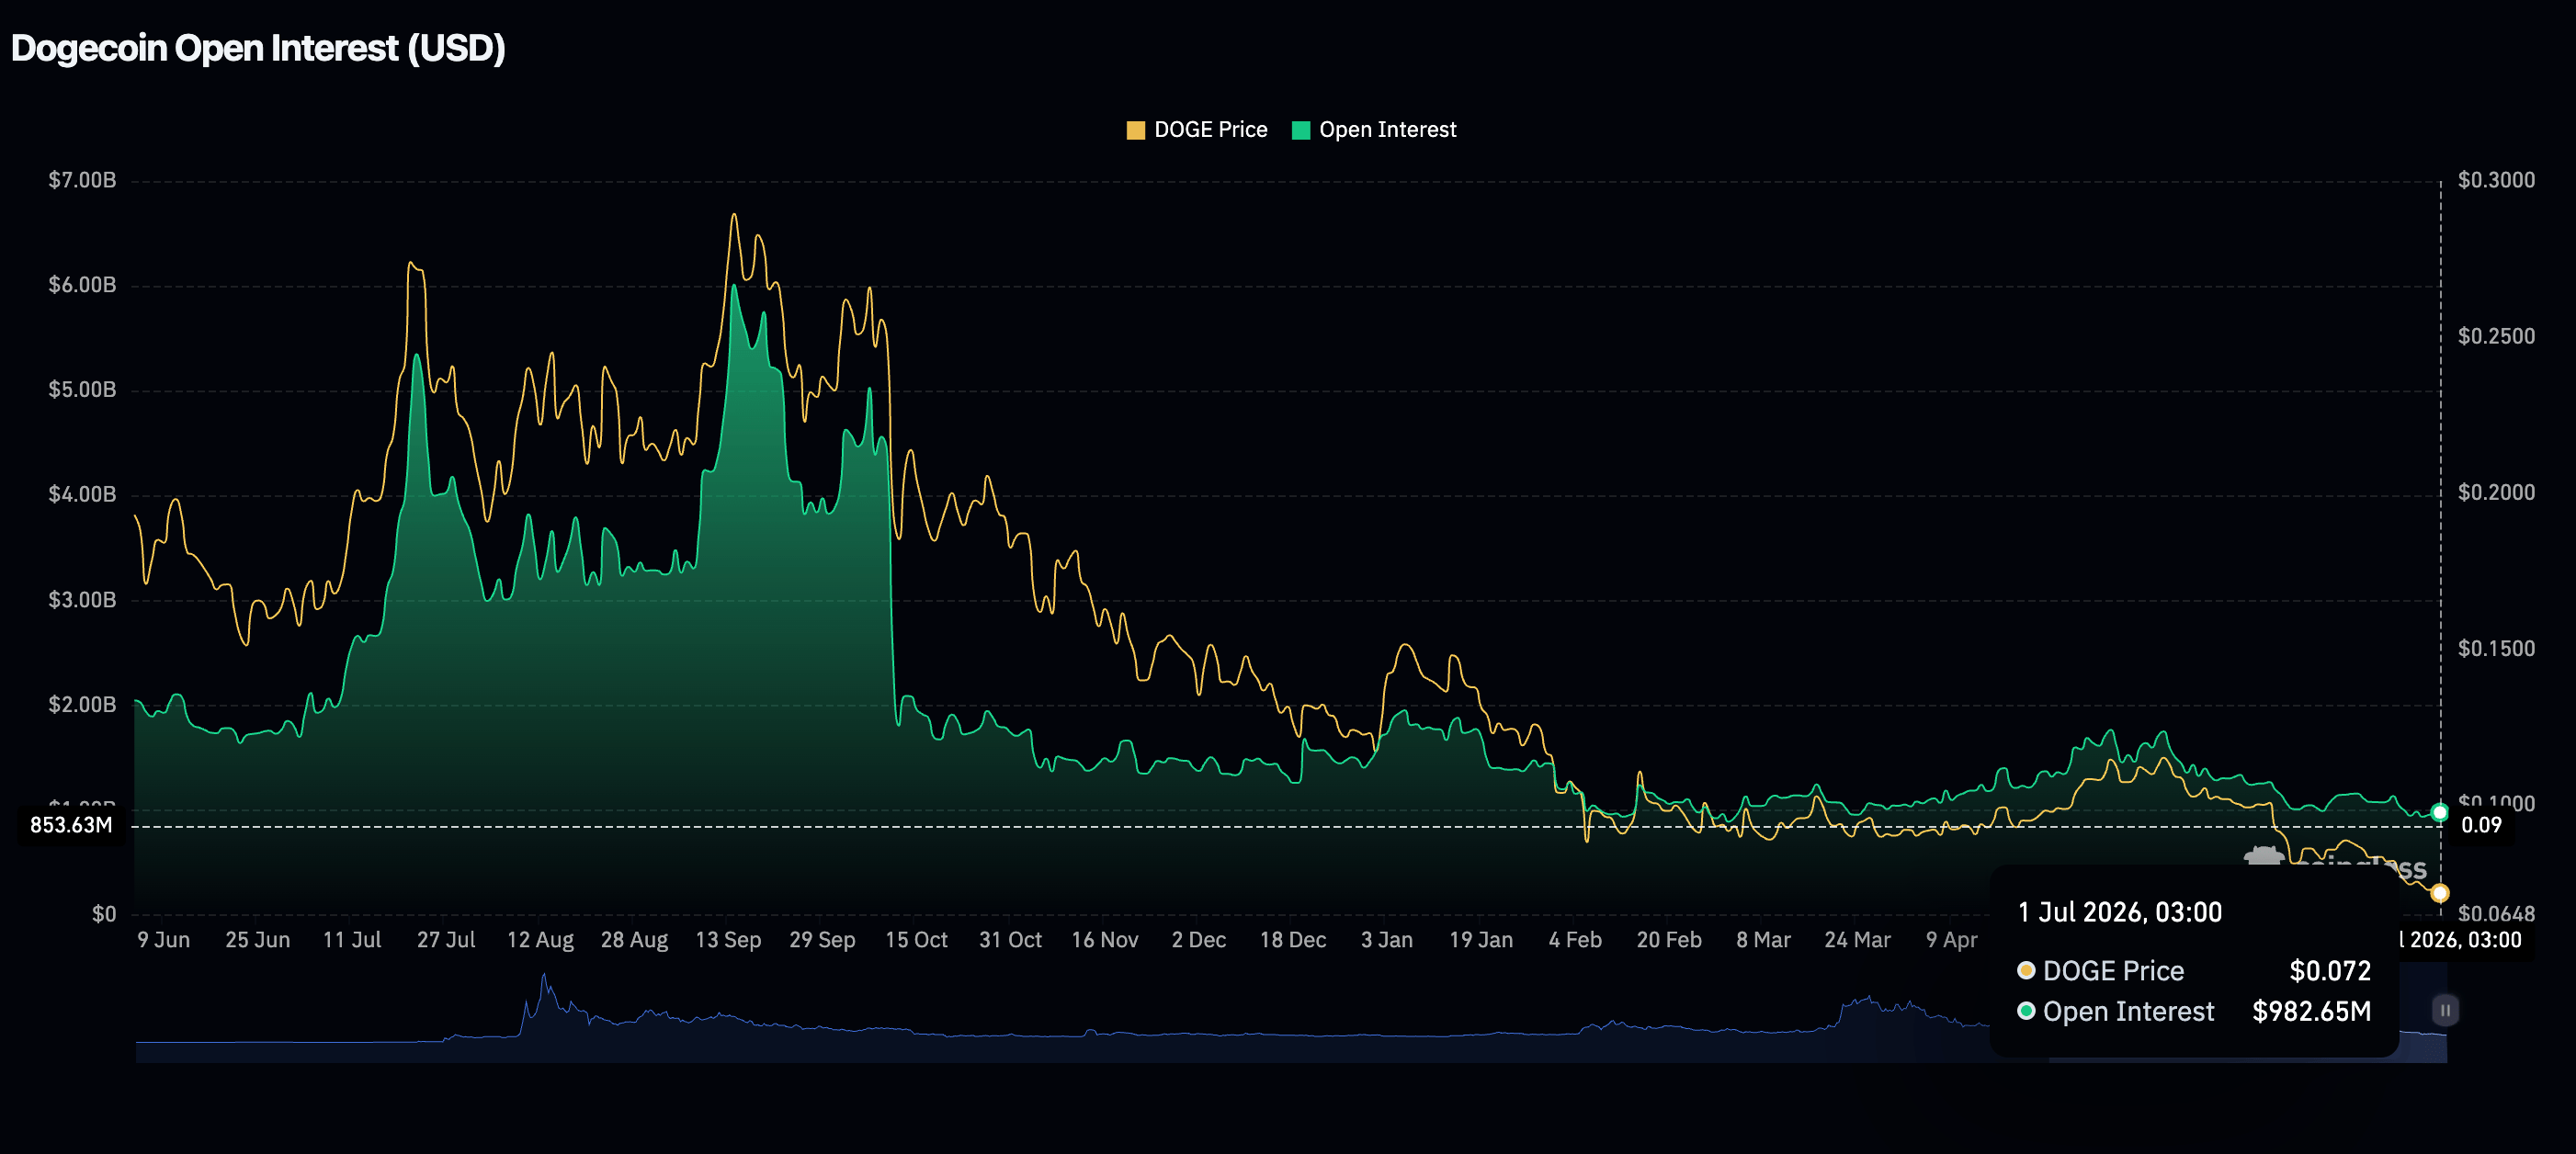
Dogecoin derivatives are holding steady, with perpetual futures Open Interest (OI) at $983 million on Wednesday, up only slightly from $971 million the day before. Despite the stability, retail uptake remains significantly lower than the $1.77 billion OI recorded in early May and the record peak of $6 billion in July, 2025. Consistent retail investor interest remains a key driver underpinning Dogecoin’s short to medium-term bullish prospects.
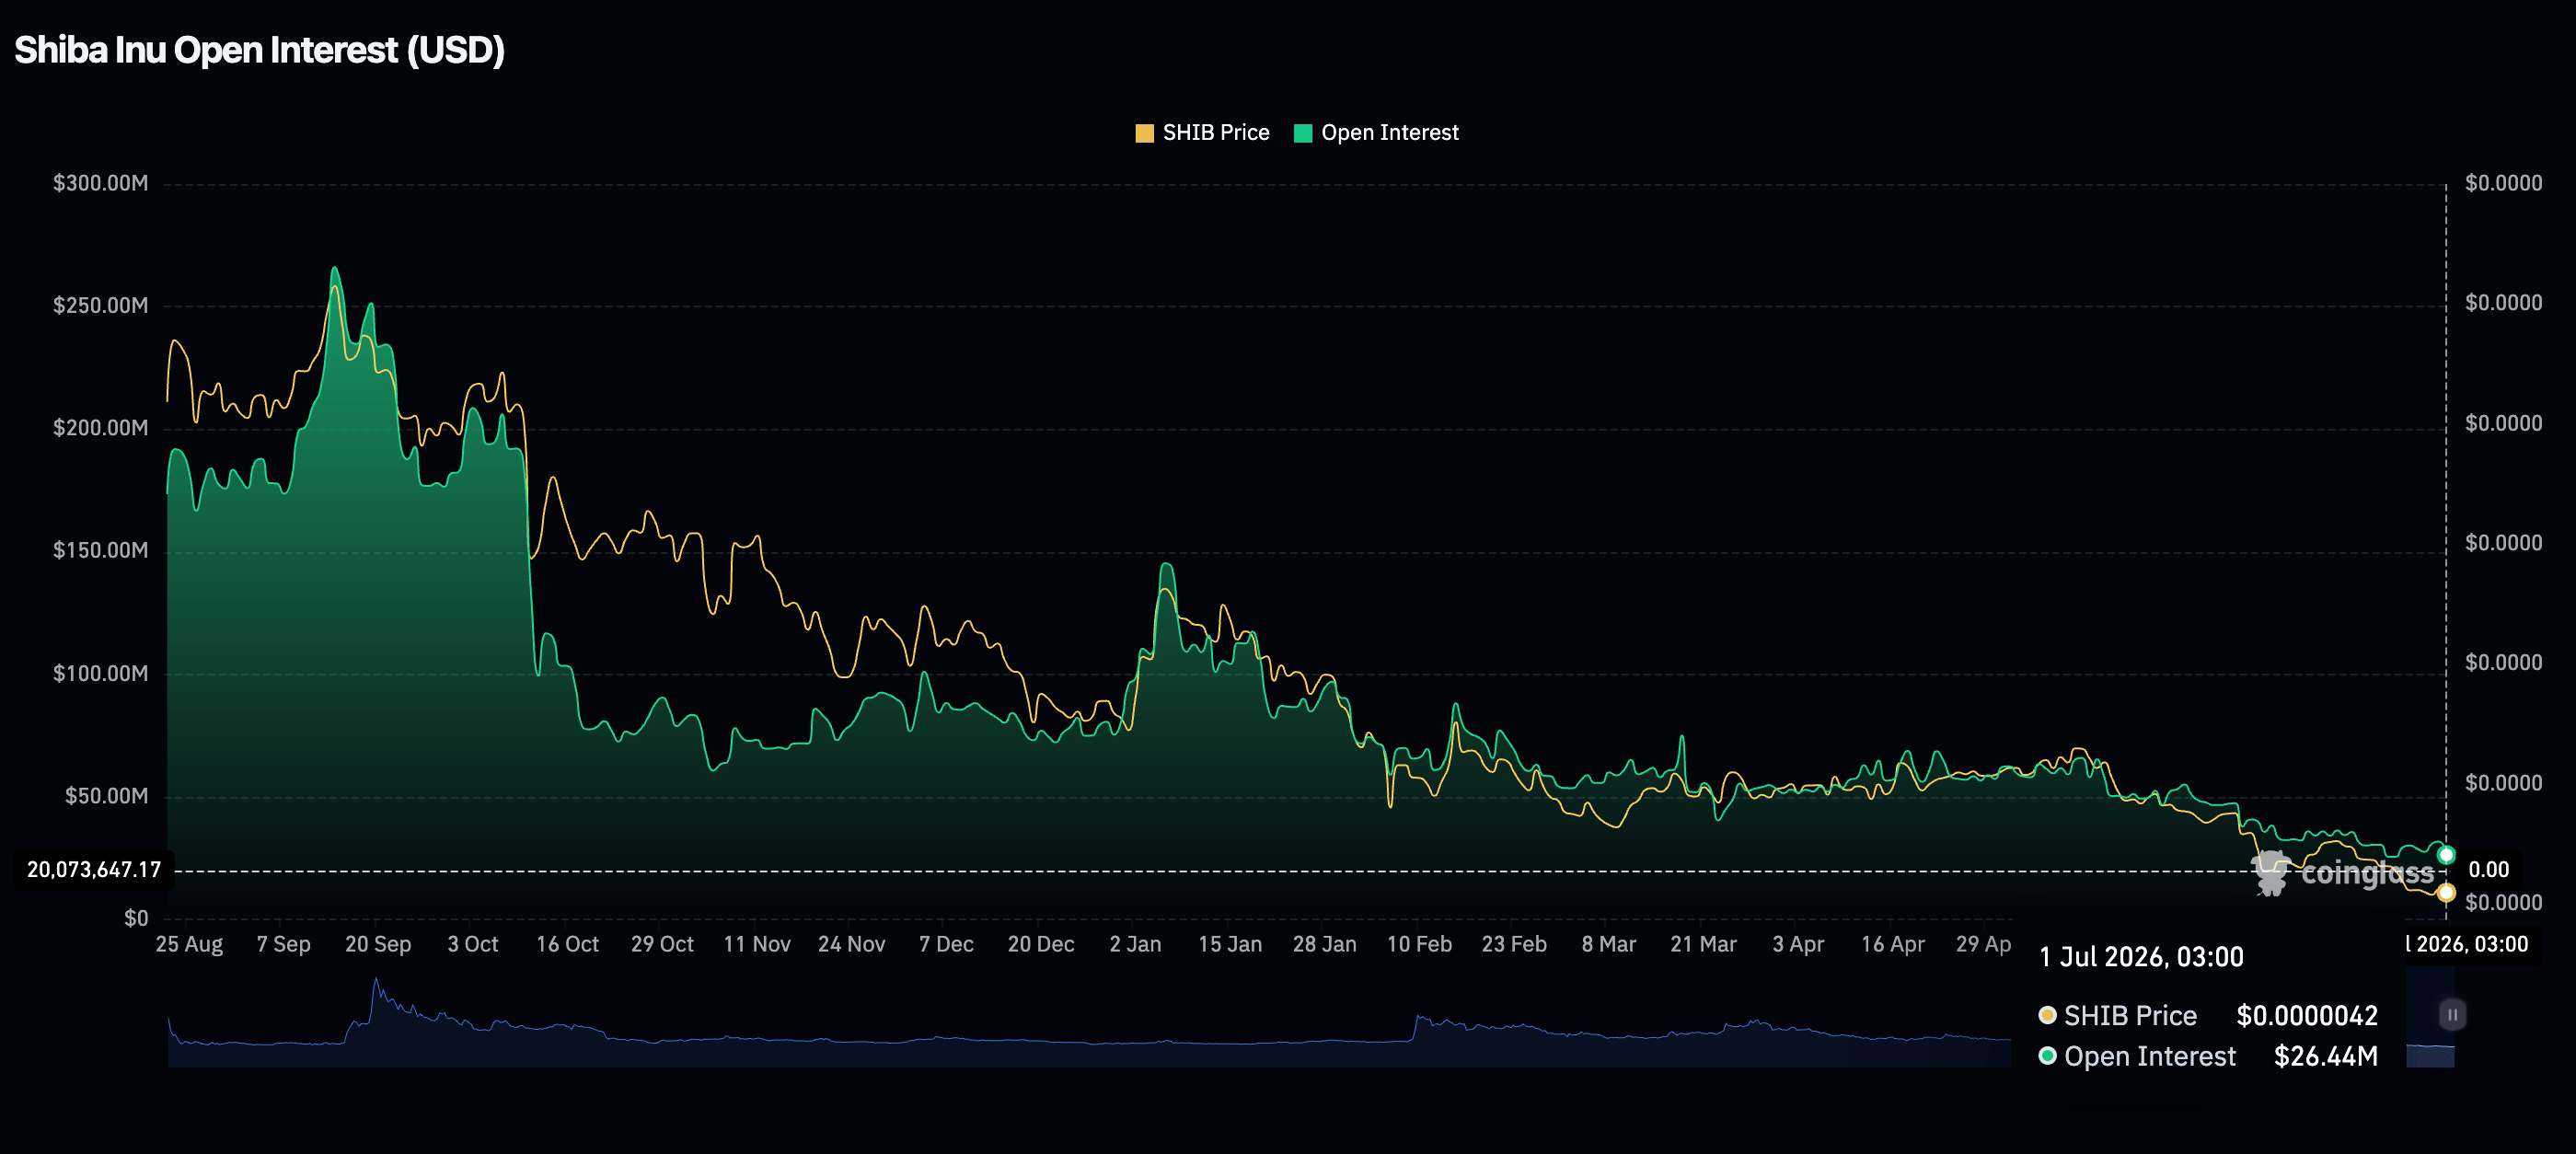
As for Shiba Inu, retail demand continues to fade, as evidenced by futures OI falling to $26 million on Wednesday, from nearly $32 million the day before. Appetite for SHIB derivatives has not improved since the beginning of the year, given that OI peaked at $145 million on January 6. The current outlook pales in comparison to the record high of $542 million set in January 2025.
Price analysis: Dogecoin bulls defend key support
Dogecoin trades at $0.073, marking a slight rebound from the immediate $0.070 support. However, the meme coin still maintains a bearish near-term tone as price holds below the Bollinger middle band at roughly $0.080 and well under the 50-day, 100-day and 200-day Exponential Moving Averages (EMAs).
The Relative Strength Index (RSI) around 26 signals oversold conditions on the daily chart, yet the Moving Average Convergence Divergence (MACD) histogram remains slightly negative, suggesting that downside momentum is still present even if stretched.
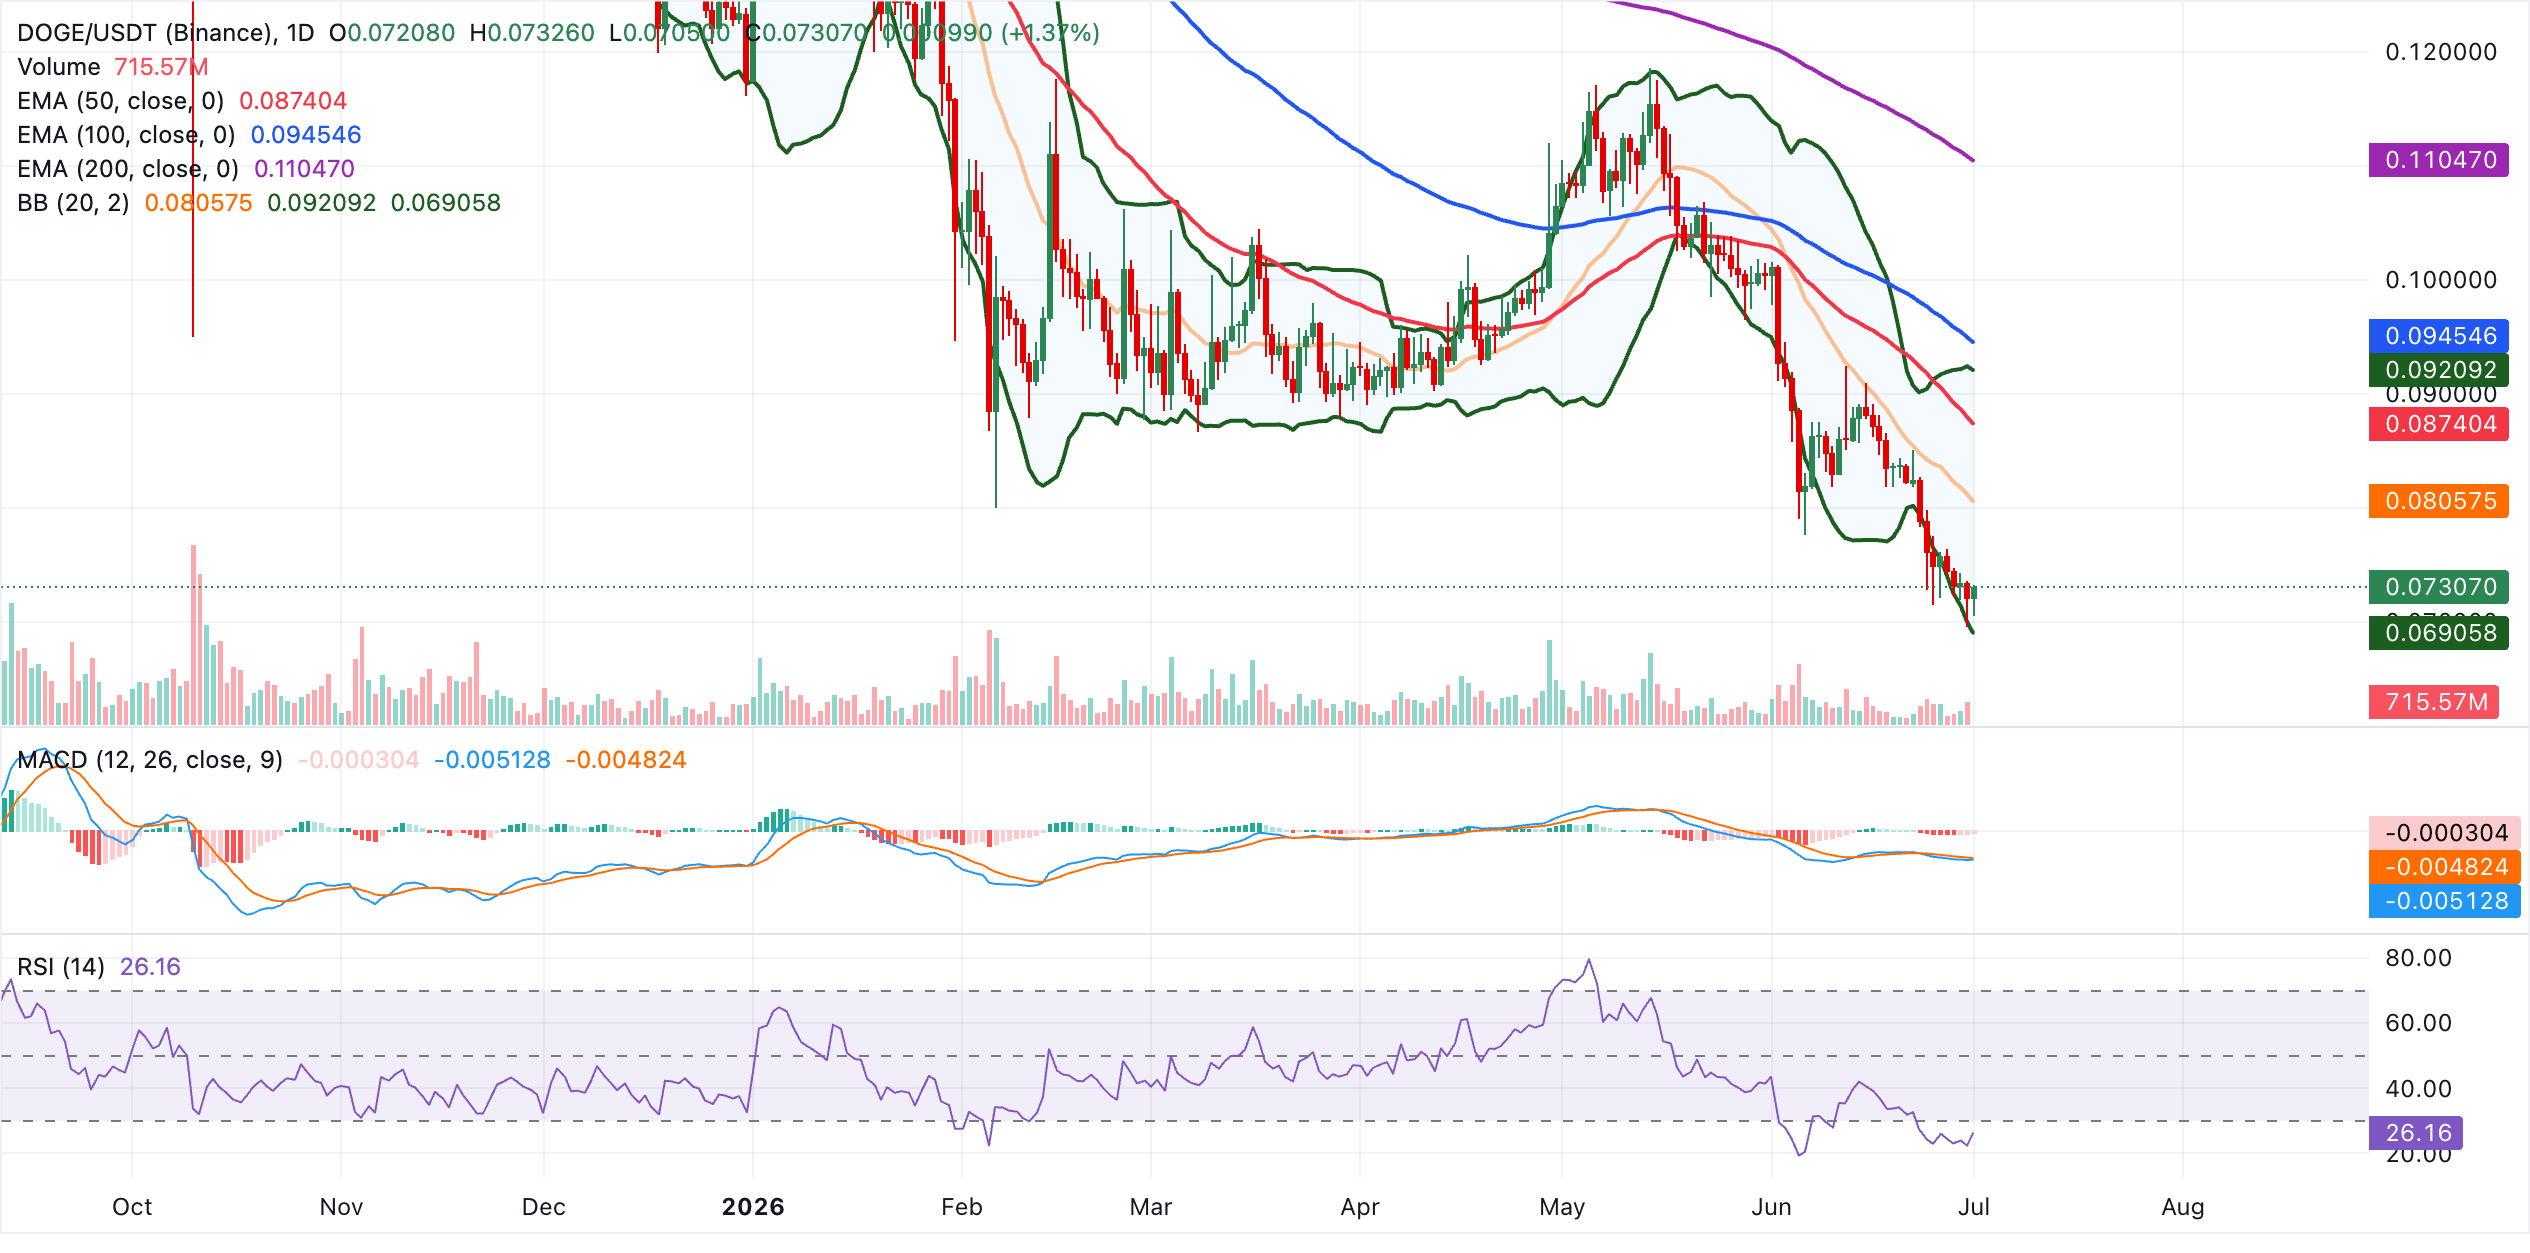
Initial resistance lies at the Bollinger middle band near $0.080, followed by the 50-day EMA and the Bollinger upper band around $0.090 , with the 100-day EMA at about $0.090 and the 200-day EMA near $0.110 reinforcing a broader supply zone above. On the downside, the Bollinger lower band at approximately $0.070 offers immediate support. A decisive break below this floor would expose fresh lows, while any rebound from this area would likely struggle as long as price remains capped beneath the mentioned EMA band.
Shiba Inu rebounds as support holds
Shiba Inu trades at $0.0000043, up over 3% on the day. The meme coin aligns with a broader short-term recovery in the crypto market, supported by the RSI, hovering above 35 on the daily chart. Despite the ongoing rebound, the RSI remains significantly below the midline, suggesting a need for stronger follow-through momentum.
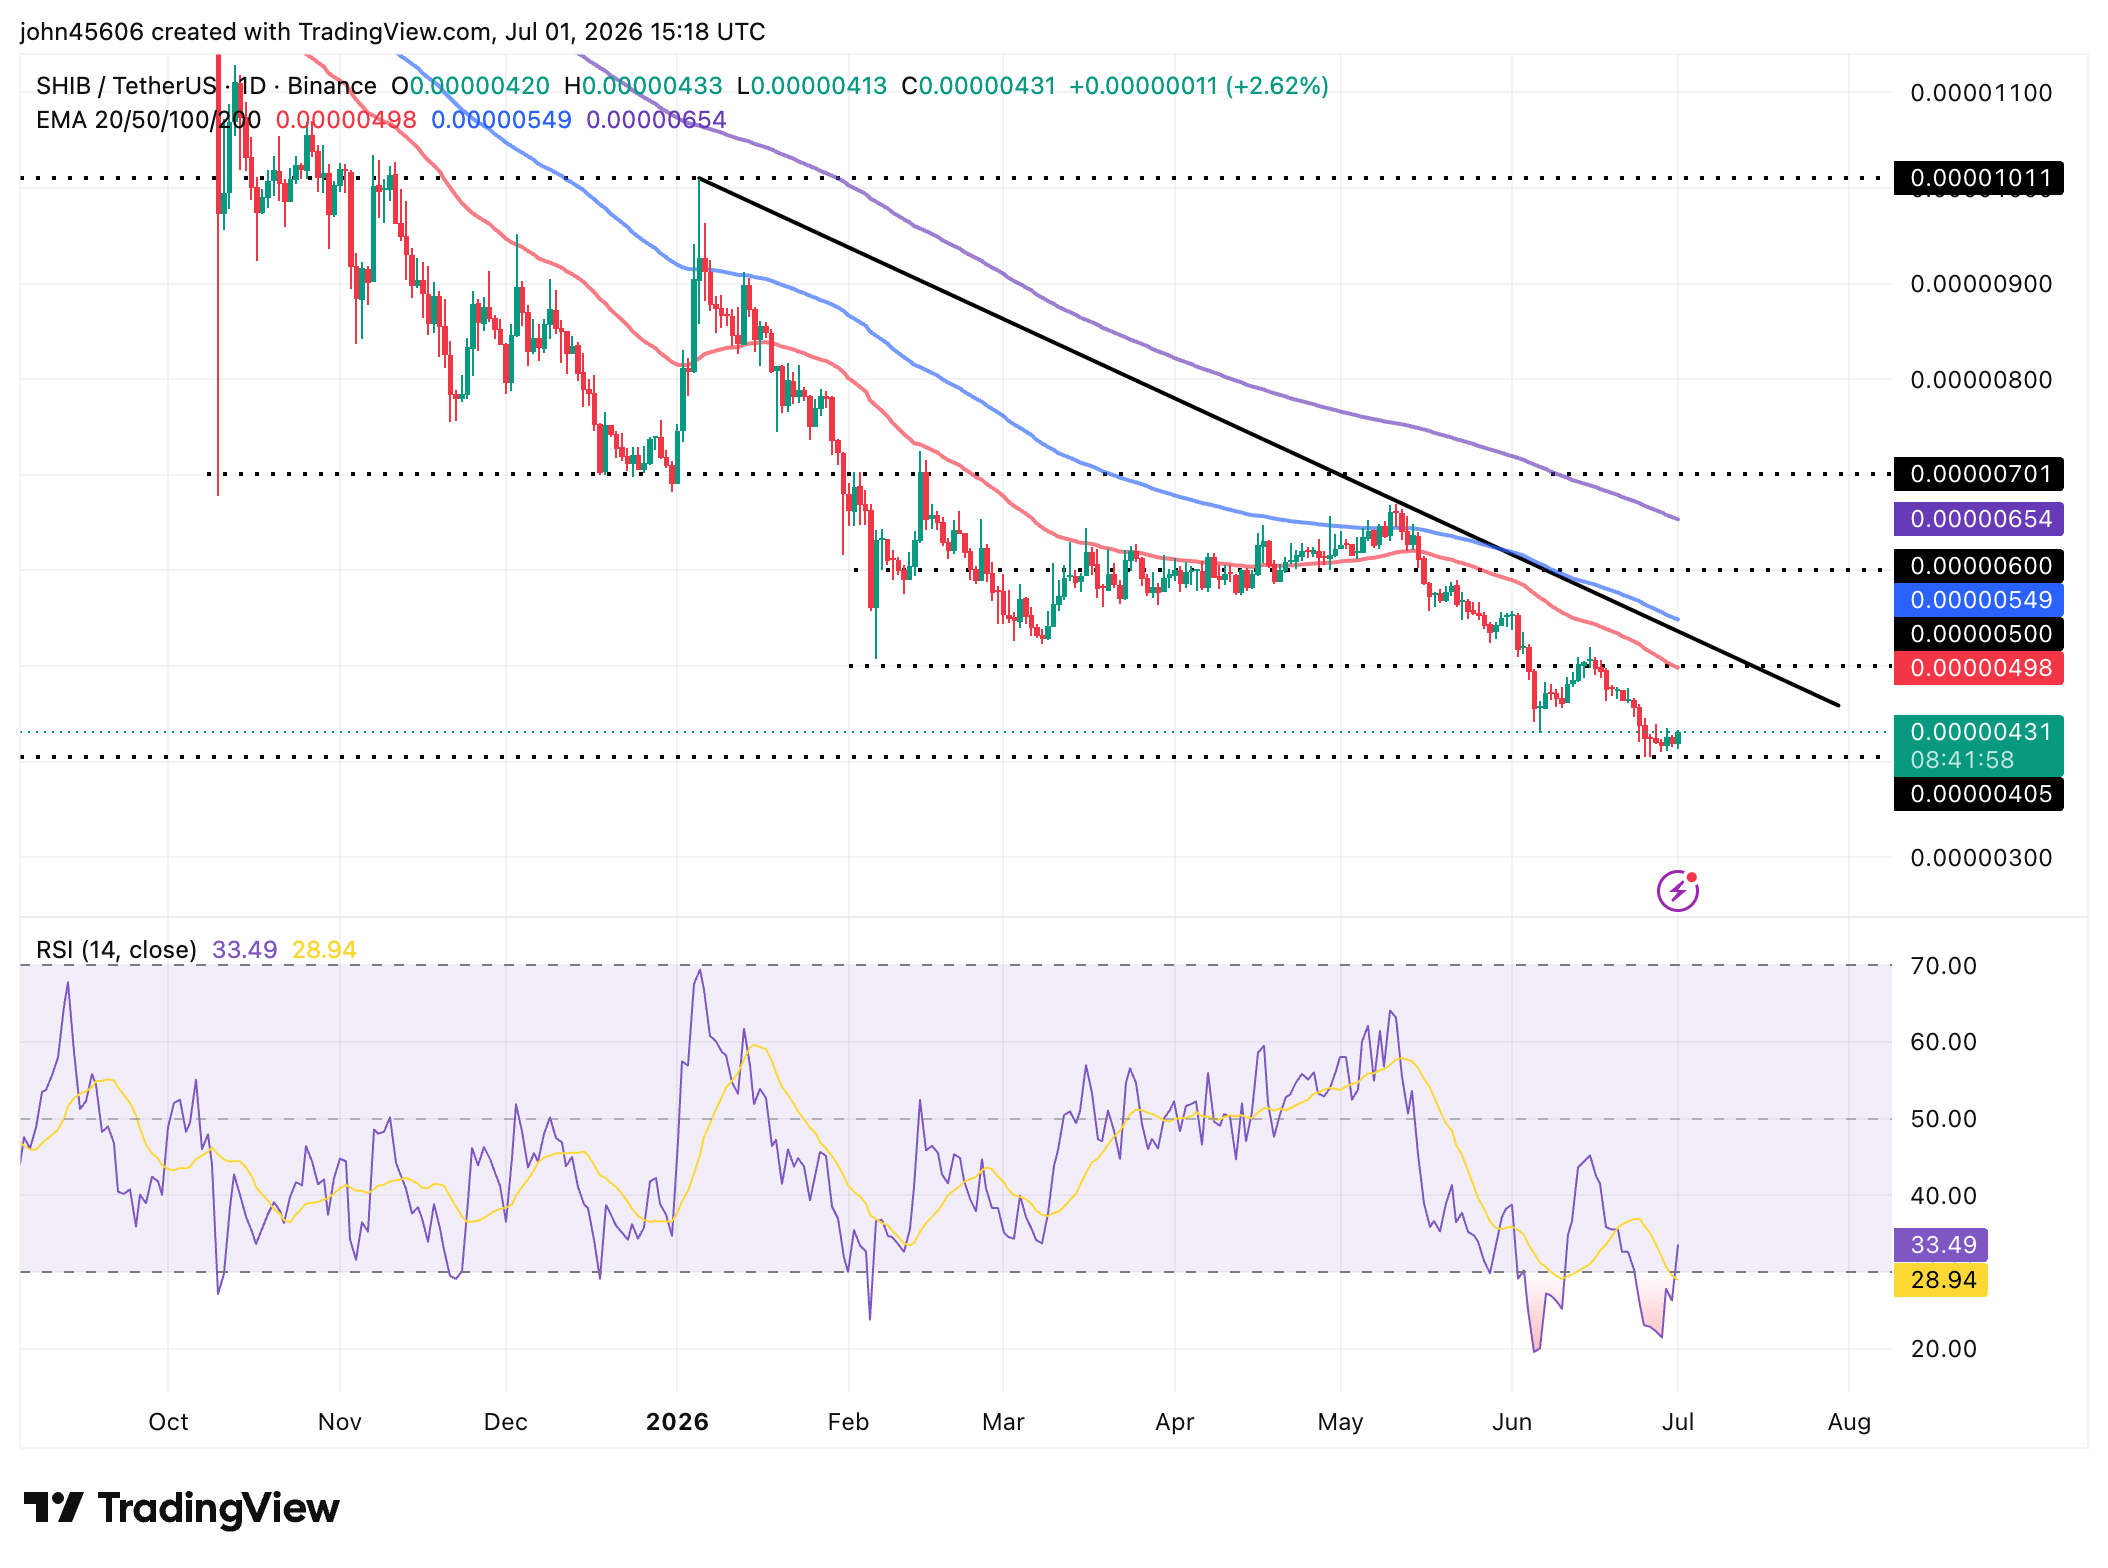
Initial resistance is highlighted by the 50-day EMA at $0.0000049, followed by the descending trendline, referenced at $0.0000054. Above these barriers, the 100-day EMA could slow the recovery at $0.0000055 ahead of the 200-day EMA at $0.0000065. On the flip side, Shiba Inu sits above the initial psychological support at $0.0000040. A decisive close below this demand area could affirm an extended bearish outlook.
(The technical analysis of this story was written with the help of an AI tool.)
Open Interest, funding rate FAQs
Higher Open Interest is associated with higher liquidity and new capital inflow to the market. This is considered the equivalent of increase in efficiency and the ongoing trend continues. When Open Interest decreases, it is considered a sign of liquidation in the market, investors are leaving and the overall demand for an asset is on a decline, fueling a bearish sentiment among investors.
Funding fees bridge the difference between spot prices and prices of futures contracts of an asset by increasing liquidation risks faced by traders. A consistently high and positive funding rate implies there is a bullish sentiment among market participants and there is an expectation of a price hike. A consistently negative funding rate for an asset implies a bearish sentiment, indicating that traders expect the cryptocurrency’s price to fall and a bearish trend reversal is likely to occur.

100만 명이 넘는 사용자가 FXStreet를 통해 실시간 시장 데이터, 차트 도구, 전문가 인사이트, 포렉스 뉴스를 이용합니다. 포괄적인 경제 캘린더와 교육 웨비나는 트레이더가 정보를 유지하고 신중한 결정을 내리도록 돕습니다. FXStreet는 바르셀로나 본사와 전 세계 지역에 걸쳐 약 60명의 팀으로 구성되어 있습니다.
더 읽기


