
Dogwifhat Price Forecast: WIF lifts up near $0.20 as bullish signals emerge
작성자 John Isige
수정됨: 5 May 2026


인기 기사

Dogwifhat (WIF) is showing signs of extending daily gains, trading near the $0.2000 short-term barrier at the time of writing on Tuesday. The meme coin has sustained recovery for the second consecutive day, building on broader positive market sentiment.
- Dogwifhat extends gains, eyeing bullish breakout at $0.2000 as crypto prices broadly increase.
- WIF’s rebound builds on the 50-day EMA support and strengthening momentum indicators.
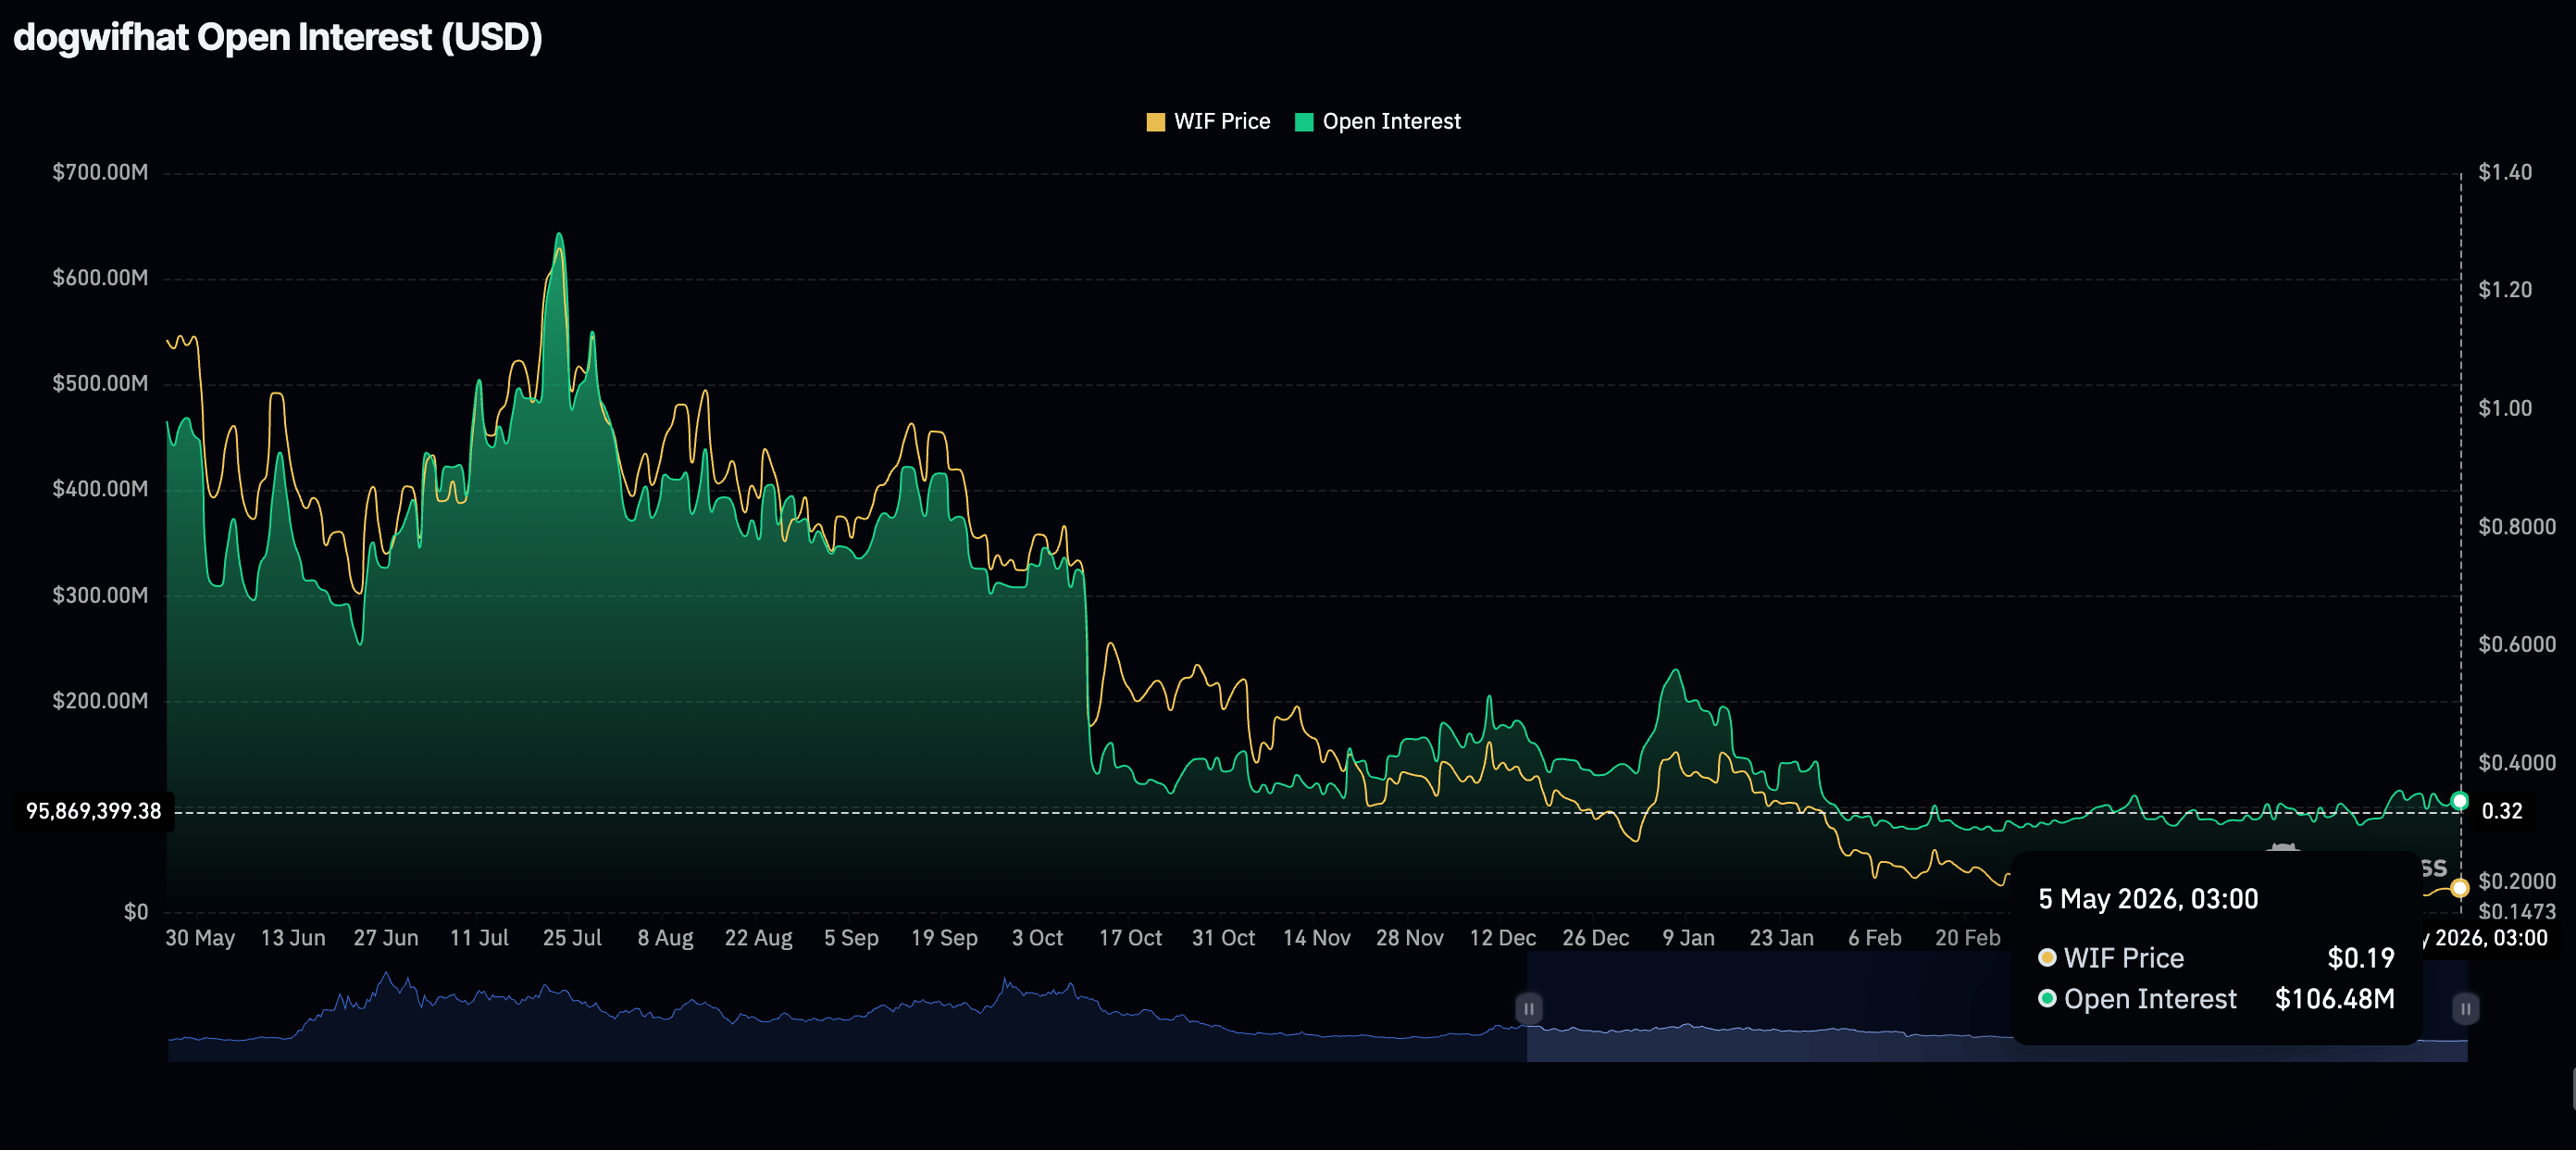
- Still, low retail demand could limit dogwifhat’s recovery potential as Open Interest remains depressed at $106 million.
Dogwifhat (WIF) is showing signs of extending daily gains, trading near the $0.2000 short-term barrier at the time of writing on Tuesday. The meme coin has sustained recovery for the second consecutive day, building on broader positive market sentiment.
Cooling retail demand could weigh on dogwifhat
The dogwifhat derivatives market remains significantly suppressed despite a sudden price increase from the weekly open at $0.1880 to highs close to $0.2000. CoinGlass data shows that the perpetual futures Open Interest (OI) averaging $106 million on Tuesday pales in comparison to the record $643 million reached in July.
Muted demand for WIF derivatives indicates lingering skepticism among investors regarding dogwifhat’s capacity to sustain gains in the short to medium term. However, a sustained uptick in OI could signal renewed confidence and support the case for a sustained recovery and a potential long-term uptrend.
Technical outlook: Dogwifhat on the cusp of a range breakout
Dogwifhat trades near $0.2000 while stabilizing above the short-term 50-day Exponential Moving Average (EMA) at $0.1930 and the Bollinger middle band near $0.1898. This support outlook sets a neutral to mildly constructive bias following the meme coin's recent pullback.
Momentum metrics lend some support to the above stance. For instance, the Relative Strength Index (RSI) on the daily chart is hovering around 57, in positive territory, and the Moving Average Convergence Divergence (MACD) histogram is turning higher and is also green.
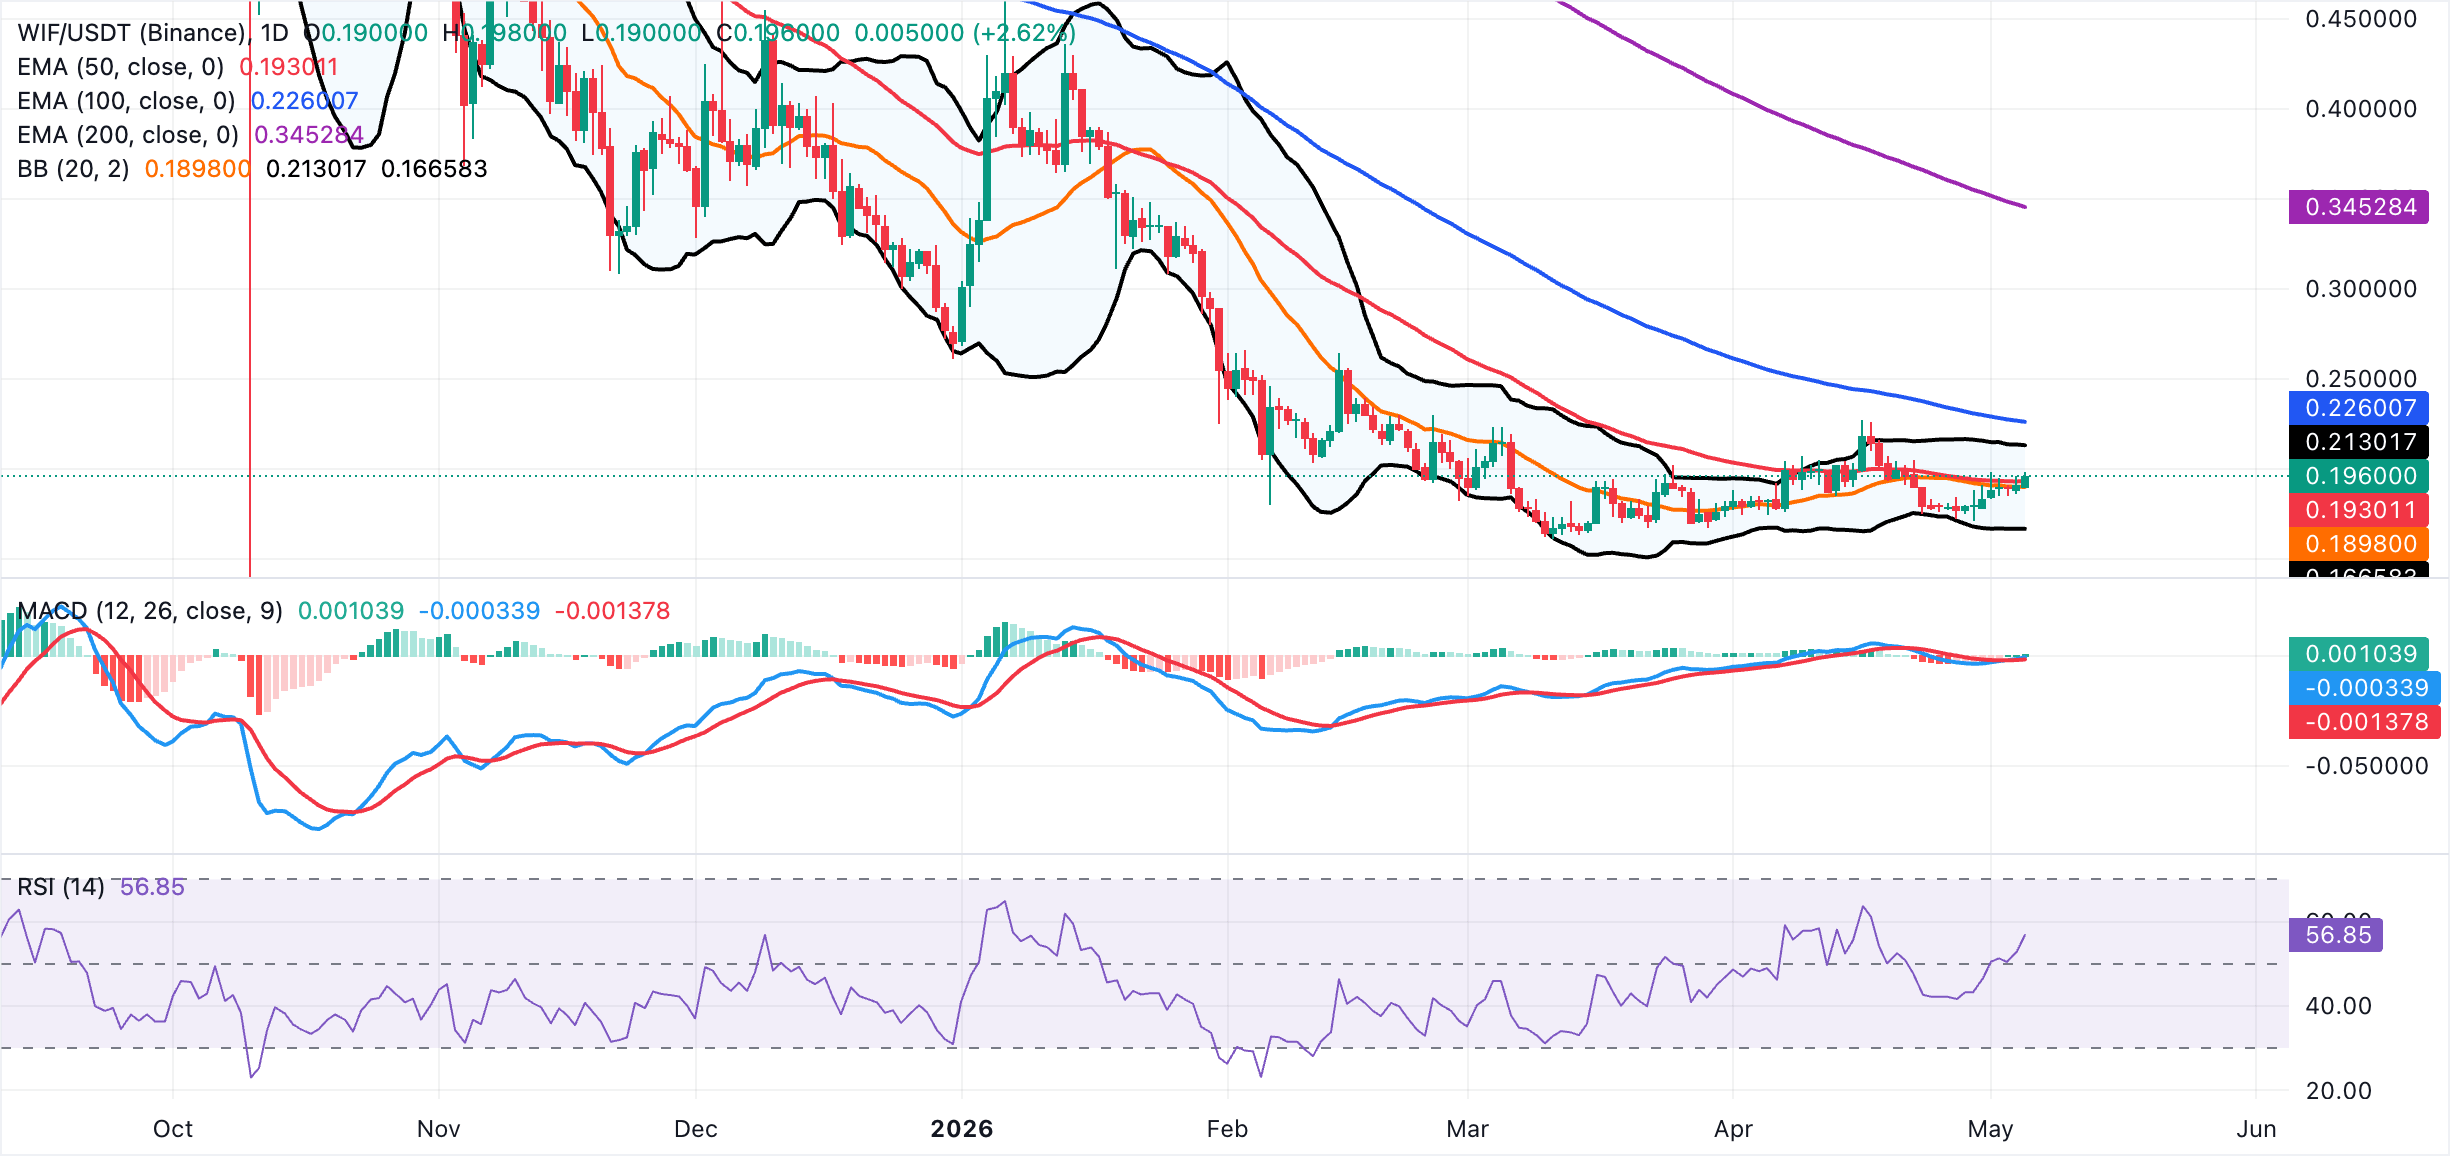
On the topside, initial resistance is aligned with the Bollinger upper band around $0.2130, where volatility caps the immediate recovery attempt, followed by the more meaningful 100-period EMA at $0.2260. A daily close above these barriers would be needed to argue for a stronger bullish extension toward the distant 200-period EMA near $0.3452.
On the downside, immediate support lies in the $0.1930–$0.1898 area defined by the 50-day EMA and the 20-period Bollinger middle band, with the lower Bollinger band near $0.1666 providing additional cushion in case of renewed selling pressure.
(The technical analysis of this story was written with the help of an AI tool.)
Open Interest, funding rate FAQs
Higher Open Interest is associated with higher liquidity and new capital inflow to the market. This is considered the equivalent of increase in efficiency and the ongoing trend continues. When Open Interest decreases, it is considered a sign of liquidation in the market, investors are leaving and the overall demand for an asset is on a decline, fueling a bearish sentiment among investors.
Funding fees bridge the difference between spot prices and prices of futures contracts of an asset by increasing liquidation risks faced by traders. A consistently high and positive funding rate implies there is a bullish sentiment among market participants and there is an expectation of a price hike. A consistently negative funding rate for an asset implies a bearish sentiment, indicating that traders expect the cryptocurrency’s price to fall and a bearish trend reversal is likely to occur.

100만 명이 넘는 사용자가 FXStreet를 통해 실시간 시장 데이터, 차트 도구, 전문가 인사이트, 포렉스 뉴스를 이용합니다. 포괄적인 경제 캘린더와 교육 웨비나는 트레이더가 정보를 유지하고 신중한 결정을 내리도록 돕습니다. FXStreet는 바르셀로나 본사와 전 세계 지역에 걸쳐 약 60명의 팀으로 구성되어 있습니다.
더 읽기


