
Dow Jones Industrial Average edges higher as Nvidia sell-off drags S&P 500 lower
작성자 Joshua Gibson
게시일: 27 Feb 2026 | 수정일: 27 Feb 2026


인기 기사

The Dow Jones Industrial Average edged higher on Thursday, gaining around 60 points or 0.11% as defensive names offset a broad semiconductor sell-off sparked by Nvidia's post-earnings decline.
- Nvidia reported record Q4 revenue, beating expectations, but shares fell around 5% on AI capex sustainability concerns.
- Semiconductor stocks sold off broadly, with Broadcom and others all declining.
- Salesforce beat on earnings, but 2027 guidance capped the stock's gains.
- Weekly jobless claims rose modestly to 212K, below forecasts, keeping the Federal Reserve on hold.
The Dow Jones Industrial Average edged higher on Thursday, gaining around 60 points or 0.11% as defensive names offset a broad semiconductor sell-off sparked by Nvidia's post-earnings decline. The S&P 500 fell around 0.7% while the Nasdaq Composite dropped approximately 1.5%, weighed down by steep losses in chip stocks. Despite a clean beat on every key earnings metric, Nvidia's results failed to ignite a broader rally, as investors questioned the sustainability of hyperscaler AI capital expenditure, which is projected to reach $700 billion in 2026.
Nvidia beats but sell-the-news trade kicks in
Nvidia (NVDA) delivered Q4 fiscal 2026 results that beat on all fronts: adjusted earnings per share (EPS) of $1.62 versus the $1.53 consensus, revenue of $68.13 billion versus $66.21 billion expected, and first-quarter guidance of $78 billion versus the Street's $72.6 billion estimate. Data center revenue hit a record $62.3 billion, up 75% year-over-year, with networking revenue surging 263% to $11 billion. Despite the blowout numbers, shares fell around 5%, marking Nvidia's worst session since April, as investors questioned whether hyperscalers can sustain their AI spending run rate. The sell-off rippled across the semiconductor space, with Broadcom (AVGO), Lam Research (LRCX), Western Digital (WDC), and Applied Materials (AMAT) all dropping more than 6%. CEO Jensen Huang pushed back on the negative sentiment in an interview with CNBC, arguing that markets "got it wrong" on AI's threat to software companies, and that firms like ServiceNow are well-positioned to build specialized agents around their existing tools.
Salesforce delivers but guidance weighs on software sector
Salesforce (CRM) posted a strong Q4, with adjusted EPS of $3.81, crushing the $3.04 consensus and revenue of $11.2 billion, rising 12% YoY, the company's fastest growth rate in two years. Agentforce and Data Cloud annual recurring revenue surged past $1.8 billion, with over 22K deals closed in the quarter, up nearly 50% QoQ. However, the stock's roughly 2% gain was capped by fiscal 2027 revenue guidance of $45.8-$46.2 billion, which implied 10-11% growth but fell short of what some analysts had hoped. The iShares Expanded Tech-Software Sector ETF (IGV) has now lost more than 10% in February, though Fundstrat's Tom Lee flagged record trading volume in the fund over the past two sessions as a potential bottoming signal.
Jobless claims hold steady, Gold pulls back
Weekly initial jobless claims rose 4K to 212K for the week ended February 21, coming in below the 215K consensus forecast and continuing to signal a stable labor market in what economists describe as a low-hire, low-fire environment. Continuing claims fell 31K to 1.833 million, covering the survey period for February's unemployment rate. The data supported expectations that the Federal Reserve (Fed) will hold rates steady at 3.50-3.75% through at least May, with CME FedWatch data showing a 98% probability of no change at the March meeting. Gold pulled back to around $5,165 per ounce, retreating from recent highs as the stronger-than-expected labor data reinforced the case for no near-term rate cuts.
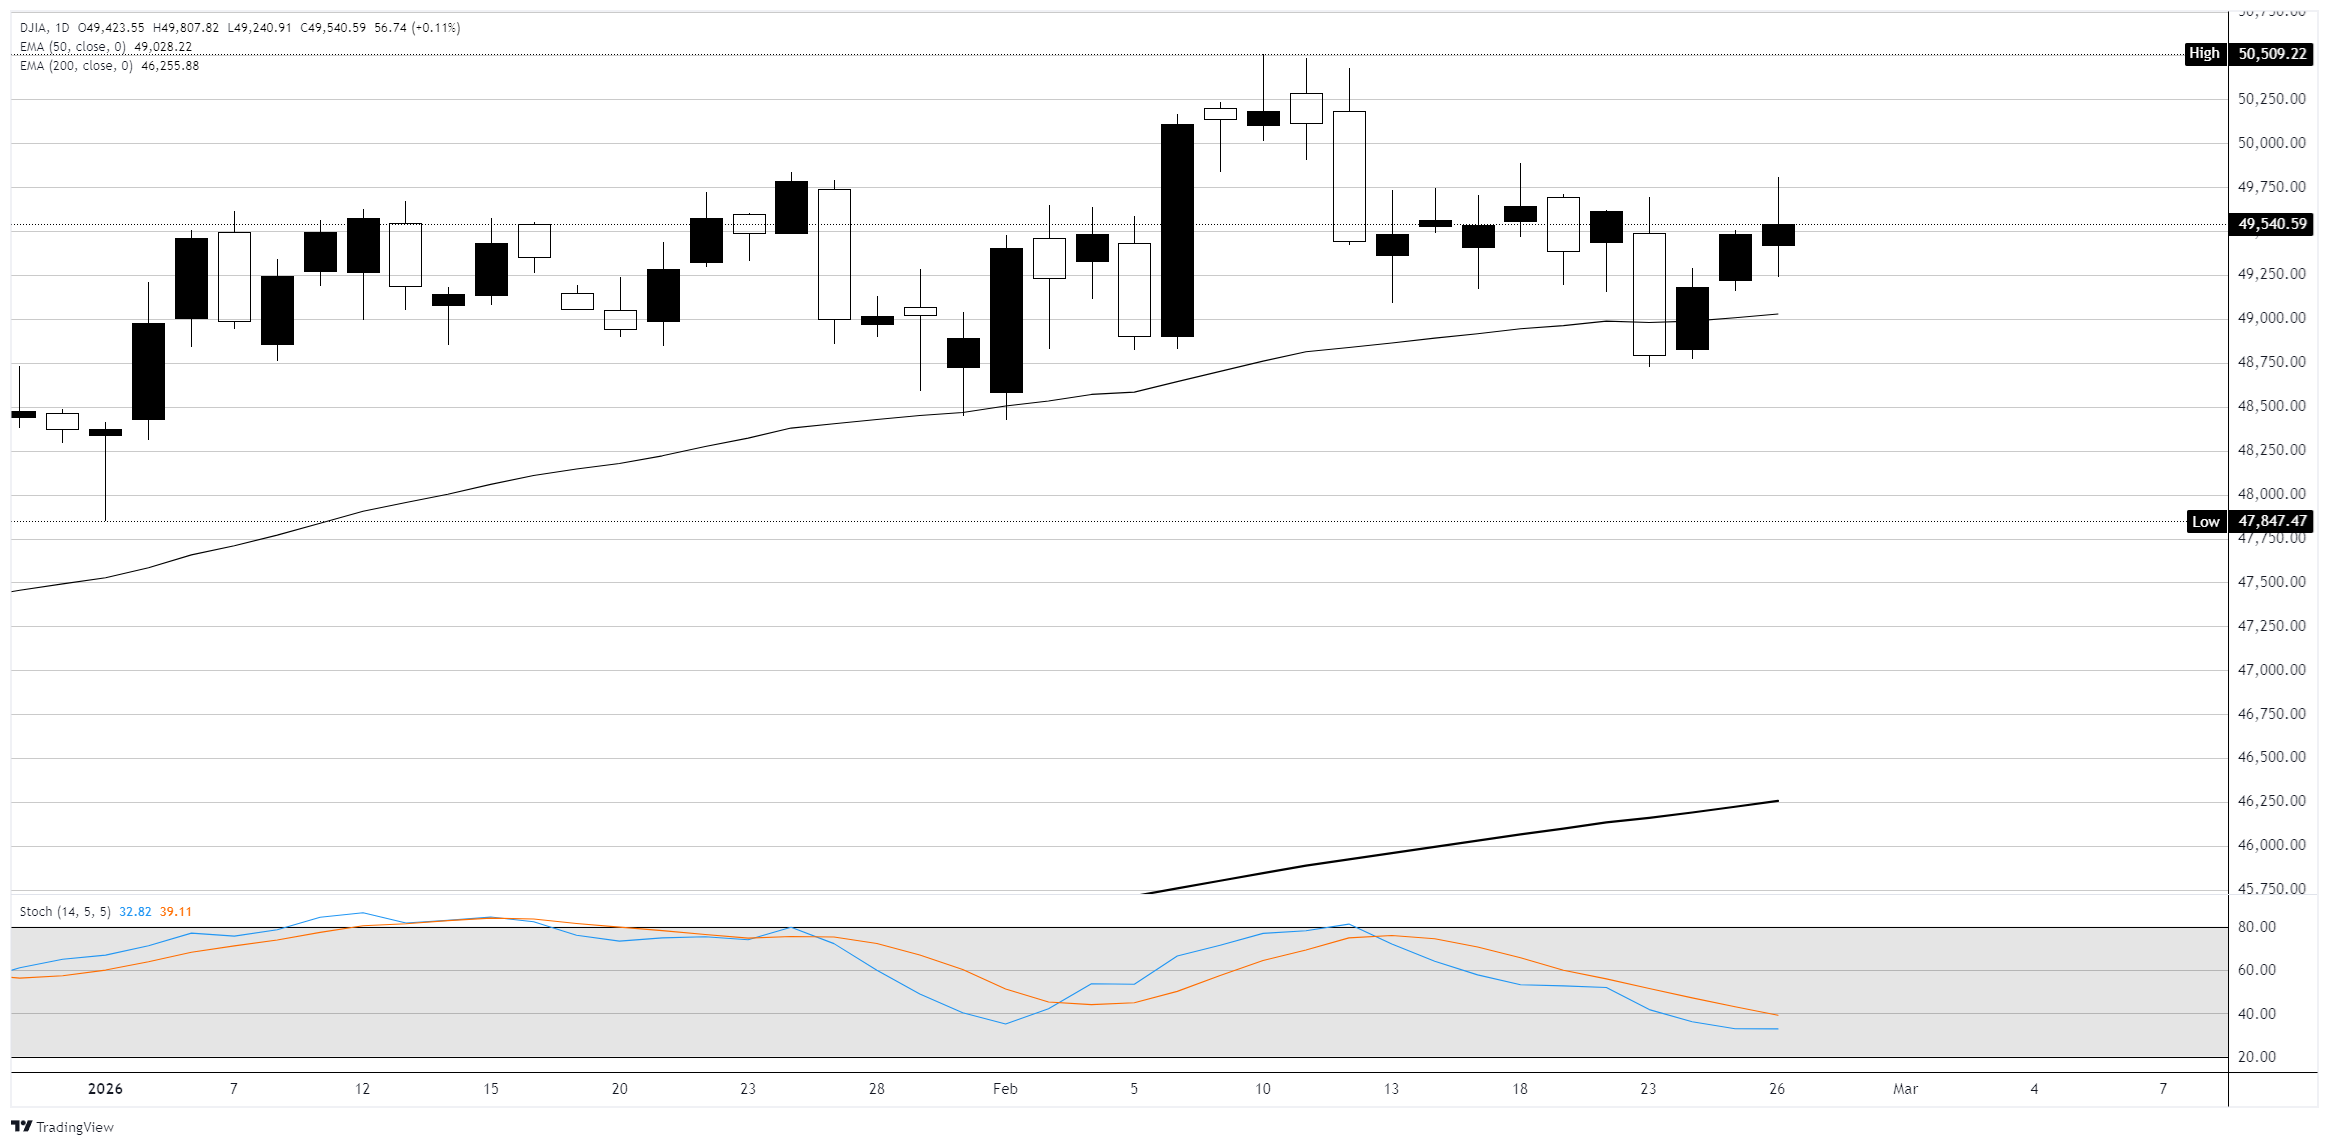
Dow Jones daily chart
Dow Jones FAQs
The Dow Jones Industrial Average, one of the oldest stock market indices in the world, is compiled of the 30 most traded stocks in the US. The index is price-weighted rather than weighted by capitalization. It is calculated by summing the prices of the constituent stocks and dividing them by a factor, currently 0.152. The index was founded by Charles Dow, who also founded the Wall Street Journal. In later years it has been criticized for not being broadly representative enough because it only tracks 30 conglomerates, unlike broader indices such as the S&P 500.
Many different factors drive the Dow Jones Industrial Average (DJIA). The aggregate performance of the component companies revealed in quarterly company earnings reports is the main one. US and global macroeconomic data also contributes as it impacts on investor sentiment. The level of interest rates, set by the Federal Reserve (Fed), also influences the DJIA as it affects the cost of credit, on which many corporations are heavily reliant. Therefore, inflation can be a major driver as well as other metrics which impact the Fed decisions.
Dow Theory is a method for identifying the primary trend of the stock market developed by Charles Dow. A key step is to compare the direction of the Dow Jones Industrial Average (DJIA) and the Dow Jones Transportation Average (DJTA) and only follow trends where both are moving in the same direction. Volume is a confirmatory criteria. The theory uses elements of peak and trough analysis. Dow’s theory posits three trend phases: accumulation, when smart money starts buying or selling; public participation, when the wider public joins in; and distribution, when the smart money exits.
There are a number of ways to trade the DJIA. One is to use ETFs which allow investors to trade the DJIA as a single security, rather than having to buy shares in all 30 constituent companies. A leading example is the SPDR Dow Jones Industrial Average ETF (DIA). DJIA futures contracts enable traders to speculate on the future value of the index and Options provide the right, but not the obligation, to buy or sell the index at a predetermined price in the future. Mutual funds enable investors to buy a share of a diversified portfolio of DJIA stocks thus providing exposure to the overall index.

100만 명이 넘는 사용자가 FXStreet를 통해 실시간 시장 데이터, 차트 도구, 전문가 인사이트, 포렉스 뉴스를 이용합니다. 포괄적인 경제 캘린더와 교육 웨비나는 트레이더가 정보를 유지하고 신중한 결정을 내리도록 돕습니다. FXStreet는 바르셀로나 본사와 전 세계 지역에 걸쳐 약 60명의 팀으로 구성되어 있습니다.
더 읽기


