

Dow Jones Industrial Average leans on defensives while the AI trade wobbles
- The Dow is the only major US index in the green while the S&P 500 and Nasdaq drift lower.
- Rotation, not conviction: consumer staples are doing the lifting while the memory-chip frenzy cools.
- A key inflation print lands tomorrow, and the tape is trading like it forgot.
The Dow Jones Industrial Average (DJIA) is having its moment, holding a modest gain near 50,700 in the mid-session while the S&P 500 and Nasdaq Composite quietly leak red. But peel back the green number and this looks less like leadership and more like a market backing into the safest corners of the room. After Tuesday flipped the script, with tech ripping and the blue-chip index lagging, Wednesday is simply running the tape in reverse.

Rotation dressed up as leadership
The lift is coming from exactly the names you would expect when conviction thins out. Procter & Gamble jumped more than 3% and Home Depot tacked on better than 2%, and in a price-weighted index a couple of high-priced defensives punch well above their weight. Underneath, the picture is uglier. Zscaler cratered more than 30% on soft guidance, dragging Palo Alto Networks and CrowdStrike lower and gutting the broader cybersecurity complex. The memory-chip euphoria is cooling too: Micron, fresh off a 19% Tuesday rocket past a $1 trillion valuation, could barely hold a gain. The Dow's strength is just the market hiding in soap and screwdrivers while the high-beta AI trade catches a chill.
Oil fades a war it cannot confirm
The other prop under equities is cheaper Oil. WTI fell more than 3% back below $90, with Brent still parked above $99, after Iranian state media floated that Strait of Hormuz traffic would return to pre-war levels within a month. There is one problem: the White House promptly called the report a complete fabrication. So the risk-on, Oil-lower tone is leaning on a de-escalation headline both sides openly dispute, a familiar pattern by now. Markets keep front-running a ceasefire nobody in authority will actually confirm, and every time the denial lands, the war premium creeps back.
The record that isn't
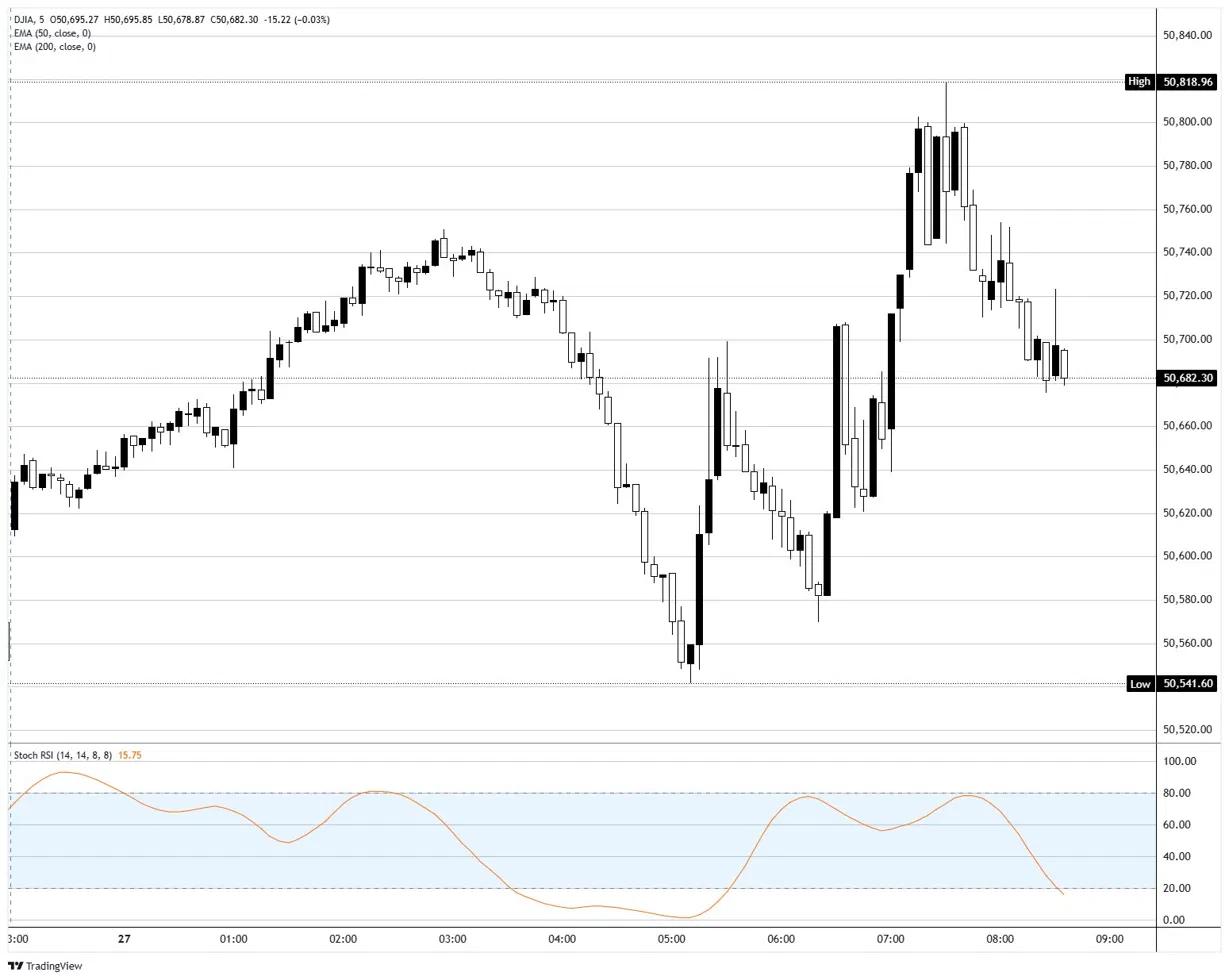
For all the record-chasing chatter, the tape tells a more sober story. On the daily chart the Dow is up around a quarter percent but sitting a few hundred points shy of this week's peak near 51,000. The overnight push toward 50,800 has already faded back to the 50,700 area, and intraday momentum has rolled into oversold even as the daily holds mid-range. The broader uptrend is intact, well clear of its rising daily moving averages, but the breakout energy simply is not there today. A green candle is not the same thing as a new high.
What tomorrow actually decides
The real catalyst is not on the screen yet. Thursday at 12:30 GMT brings the Core Personal Consumption Expenditures Price Index (PCE), the Federal Reserve's (Fed) preferred inflation gauge, alongside Q1 Gross Domestic Product (GDP), jobless claims and durable goods. Consensus pegs core PCE at 0.3% MoM and 3.3% YoY, a tick up from the prior 3.2%. With April Consumer Price Index (CPI) already running hot near 3.8% and the Fed parked at 3.50-3.75%, CME FedWatch shows roughly a 70% chance of another hold in June against just under 30% for a cut, and a small but growing camp betting on no cuts at all this year. A firm PCE print would quietly bury what little easing hope is left, and a hot one would put the hike tail back in play.
Levels and bias
The overnight high near 50,800 is the line in the sand; reclaim and hold it and a retest of the 51,000 record opens up. Fail there and the index stays pinned, with the 50,500 overnight low the first support and the round 50,000 below that. Oversold intraday momentum argues for a near-term bounce, but with the daily still constructive and the data looming, this is a defensive-led, range-bound tape until the print breaks it. Trade the range, respect the release.
Dow Jones 5-minute chart
Futures FAQs
The futures market is an exchange-based auction in which participants buy and sell contracts of an underlying asset at a predetermined future date and price. The set price is agreed upon today and is derived from the underlying asset. Futures contracts can be based on a wide range of assets, with commodities among the most popular, although currencies and indices are other common underlying assets. Futures prices depend on their underlying asset and act as a mechanism for firms, institutions, and large-position traders to manage risks through hedging.
Futures can be traded in different ways. The most common ways are via a regulated exchange or via Contracts For Difference (CFDs). In the former, liquidity is high and pricing is more transparent, with the broker serving only as an intermediary between you and the market. Still, it generally requires more capital. The largest futures exchanges are the Chicago Mercantile Exchange (CME) and the New York Mercantile Exchange (NYME). As for CFDs, these require less capital and thus trading is more flexible, but at the cost of less transparency.
The E-mini S&P 500 index, Crude Oil (Brent, WTI), Natural Gas, Gold, Silver, Copper, and soft commodities such as grains are among the most actively traded contracts. These offer strong liquidity and are closely followed by traders worldwide. Futures market volume consistently exceeds spot market volume, often significantly. This dominance is driven by leverage, hedging, and higher liquidity on exchanges.
Yes. Future gauges, particularly equity index futures such as those of the S&P 500 or the Nasdaq, are widely considered key gauges of market sentiment because they reflect investors’ expectations for the next session’s opening price. When equity futures drop, it is a sign of risk-aversion, signaling bearish market sentiment. On the contrary, rising equity futures suggest markets are risk on.
As a futures contract approaches its maturity date, the futures price converges upon the spot price, becoming almost identical at expiration. However, prices can diverge significantly before the contract ends. A market is in contango when future prices are higher than spot prices, while the mirror image is called backwardation (when current prices are higher than future prices). For commodities, the normal state of the market is contango because holding the asset over time incurs costs such as storage or insurance fees. When markets turn from contango to backwardation – or vice versa – it signals a shift in the trend: a change from contango to backwardation is taken as a bullish sign, while going from backwardation to contango is generally considered bearish.














