

Dow Jones Industrial Average rebounds on earnings as Trump trades one war for another
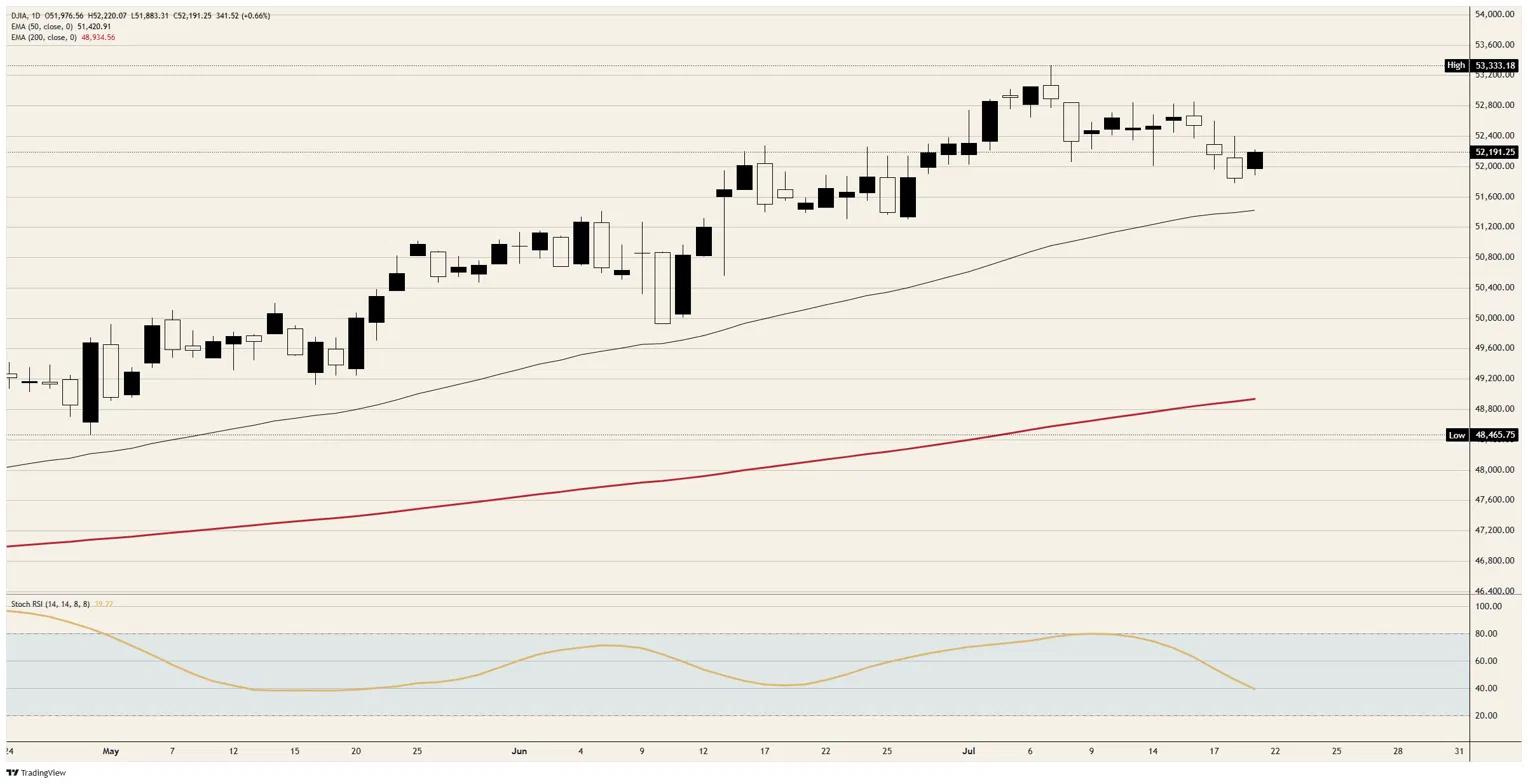
- DJIA climbed around 340 points to snap a three-day losing streak, though the rebound stalled at the 52,200 level, still well short of early July's record.
- Beats from 3M and General Motors and a broad semiconductor rally power the session as investors look through a tenth consecutive night of strikes on Iran.
- Washington opens a 50% tariff front against Canada while ADP's weekly hiring gauge slows for a fourth straight week into a thin docket capped by Friday's PMI round.

The Dow Jones Industrial Average climbs around 340 points, or 0.7%, on Tuesday, snapping a three-day slide that had pulled the index away from early July's record just above 53,300. The rebound runs out of steam at the 52,200 level, and the Dow changes hands just beneath that ceiling late in the session, roughly 2% short of the high-water mark.
The advance comes with Central Command's air campaign against Iran running into a tenth consecutive night and Crude Oil adding 2%, West Texas Intermediate back above $85 with Brent above $91. Equity investors have filed the war under background noise for now: reports of a mediator-drafted 10-day ceasefire proposal give the peace trade a faint pulse, and a strong earnings tape gives the index a reason to look elsewhere.
Earnings do the lifting
3M jumps more than 9% after a second-quarter beat, and General Motors clears both revenue and profit estimates for a 3% gain, extending a reporting season that has opened emphatically: nearly 88% of the roughly 66 S&P 500 companies to report so far have topped profit estimates, per FactSet. Alphabet, IBM and Tesla headline the docket later this week.
Semiconductors supply the torque beneath the surface, with the benchmark chip exchange-traded fund up 3%, Micron adding 7%, Intel more than 5%, and Marvell around 6%. Sell-side commentary frames the coming fortnight as the defining stretch of the season and warns that, after the run to records, good results are no longer automatically good enough. A market priced for perfection has started grading on a curve, and companies that miss are being sent home with a note.
A tariff sequel timed to a stale print
Washington supplies the counterweight to the cheer, with Monday's 50% tariff on most Canadian goods taking effect as retaliation for what administration officials call discrimination against American products. US Trade Representative Jamieson Greer added Tuesday that action against dozens of countries is coming soon, responding to a Financial Times report that the White House plans a fresh tariff wave before its 10% global levy expires.
The sequencing tells its own story: after weeks in which Iran supplied every headline, the president is steering attention back toward the trade war he prefers, and the apparent licence is June's Consumer Price Index, which fell 0.4% on the month and cooled to 3.5% YoY. Reading that print as room to manoeuvre ignores what produced it, since the decline was almost entirely a peace-dividend energy artifact, gasoline down 9.7% in a month, and the ceasefire behind those pump prices collapsed before the ink on the release dried.
The import bill argues even more directly against the manoeuvre: all-import prices rose 7.1% YoY in June, the fastest since August 2022, with nonfuel imports up 4.2%, and because the index excludes duties, those are border prices before any tariff applies. Exporters are not absorbing the levies, so a 50% surcharge on Canadian goods lands on top of the steepest import-price inflation in four years and gets paid, ultimately, by the constituents the president answers to.
A silent Fed and a freezing labour market
The Federal Reserve sits in its pre-meeting blackout ahead of the 29 July decision, and for once the silence subtracts nothing: under its new chair the statement runs about 130 words, forward guidance has been struck entirely, and the standing philosophy holds that markets should react to data rather than guess the committee. A blackout is difficult to distinguish from the communications policy it interrupts.
The data offered for reaction keeps softening at the margin: the weekly estimate from Automatic Data Processing (ADP), a 4-week moving average born during last autumn's official data blackout, shows private employers adding an average of 16.5K jobs a week, down from 19.25K, a fourth straight week of slowing that fits the low-hire, low-fire freeze in June's 57K Nonfarm Payrolls print. Rate markets barely blink, still pricing a July hold near 86%, at least one hike roughly two-thirds priced by September, and a full hike by year-end.
A thin docket until Friday's PMI double bill
The calendar offers little resistance before the back of the week: Initial Jobless Claims land Thursday at 12:30 GMT, with consensus at 212K against 208K prior, a drift higher that would corroborate the freeze without alarming anyone. Friday at 13:45 GMT brings July's flash S&P Global Purchasing Managers Index (PMI) round, Manufacturing seen accelerating to 54.5 from 53.9 while Services slips to 51 from 51.2 and the Composite starts from 51.9, before June New Home Sales at 14:00 GMT follow May's 7.3% drop.
The split inside that PMI pair is the tell worth watching, because a goods sector accelerating into a tariff regime while services grind toward the stagnation line reads like the tariff economy in miniature: output pulled forward and prices pushed up on one side, the consumer-facing side stalling on the other. It is the first red-band test of whether the trade-war pivot lands on an economy that can absorb it.
Dow Jones Industrial Average technical levels
Resistance: The 52,200 level caps the rebound, with mid-July's congestion around 52,400 stacked behind it and the record just above 53,300 the destination beyond that.
Support: The 52,000 handle is the first floor, backed by the week's low near 51,800. Below there, the rising 50-day Exponential Moving Average near 51,400 is the line that keeps the summer uptrend intact.
Bias: Bullish while the index holds the 52,000 handle, though the daily Stochastic Relative Strength Index easing through the 40 area says the bounce still needs Friday's data to refuel. A daily close above the 52,200 level reopens the record; a break below 51,800 turns this pullback into a deeper retracement toward the 50-day average.
Dow Jones daily chart
Dow Jones FAQs
The Dow Jones Industrial Average, one of the oldest stock market indices in the world, is compiled of the 30 most traded stocks in the US. The index is price-weighted rather than weighted by capitalization. It is calculated by summing the prices of the constituent stocks and dividing them by a factor, currently 0.152. The index was founded by Charles Dow, who also founded the Wall Street Journal. In later years it has been criticized for not being broadly representative enough because it only tracks 30 conglomerates, unlike broader indices such as the S&P 500.
Many different factors drive the Dow Jones Industrial Average (DJIA). The aggregate performance of the component companies revealed in quarterly company earnings reports is the main one. US and global macroeconomic data also contributes as it impacts on investor sentiment. The level of interest rates, set by the Federal Reserve (Fed), also influences the DJIA as it affects the cost of credit, on which many corporations are heavily reliant. Therefore, inflation can be a major driver as well as other metrics which impact the Fed decisions.
Dow Theory is a method for identifying the primary trend of the stock market developed by Charles Dow. A key step is to compare the direction of the Dow Jones Industrial Average (DJIA) and the Dow Jones Transportation Average (DJTA) and only follow trends where both are moving in the same direction. Volume is a confirmatory criteria. The theory uses elements of peak and trough analysis. Dow’s theory posits three trend phases: accumulation, when smart money starts buying or selling; public participation, when the wider public joins in; and distribution, when the smart money exits.
There are a number of ways to trade the DJIA. One is to use ETFs which allow investors to trade the DJIA as a single security, rather than having to buy shares in all 30 constituent companies. A leading example is the SPDR Dow Jones Industrial Average ETF (DIA). DJIA futures contracts enable traders to speculate on the future value of the index and Options provide the right, but not the obligation, to buy or sell the index at a predetermined price in the future. Mutual funds enable investors to buy a share of a diversified portfolio of DJIA stocks thus providing exposure to the overall index.














