

Dow Jones Industrial Average treats the ceasefire's second death as a rerun
- DJIA adds 0.26% to trade near 52,600, two sessions removed from a record high and still on track for a small weekly loss.
- President Trump repeats his ceasefire obituary on social media while Tehran denies that fresh talks are scheduled, and equities barely blink.
- Tuesday's US inflation print is the real threat to the record tape, with markets pricing roughly one-in-four odds of a July hike.
The Dow Jones Industrial Average trades at 52,609 on Friday, up 0.26%, two sessions after printing a record 53,333 and one news cycle into the second official death of the US-Iran ceasefire. The index shook off a morning slip to 52,410 and now sits mid-range, on track to surrender just under 1% for the week while the S&P 500 paces toward a 1% weekly gain.

A ceasefire obituary with shrinking box office
President Trump declared the ceasefire over on Wednesday after Tehran attacked commercial vessels in the Strait of Hormuz, then repeated the declaration in a Friday morning social media post that added nothing to the original except the date. Iranian sources spent the same morning rejecting rumours that a fresh round of talks is scheduled for next week, even as Qatar and Pakistan work both capitals and Washington insists technical talks continue in the background.
The shooting itself has been real enough. US forces have struck Iranian targets more than 170 times across two days, Tehran has answered with ballistic missiles fired at a base in Jordan and attacks on commercial shipping, and tanker traffic through the Strait has slowed to a trickle. Equities have simply stopped paying for it; Thursday's session rallied on a claim that Iran had called to negotiate, and Friday's rerun of the collapse drew a modest bid rather than a rush for cover.
Each iteration of the collapse-and-courtship cycle now commands a smaller risk premium than the last. That repricing is rational if the conflict stays contained to the Gulf's shipping lanes and irrational if it does not, and the market has evidently decided not to pay for the second scenario until it arrives.
The week's real story trades on the Nasdaq
SK Hynix supplied Friday's actual news, opening its American depositary receipts at $170 against a $149 pricing in a $26.5 billion raise, with the stock trading up around 14% by mid-session. The debut rattled the US memory complex it now competes with for capital: Micron shed more than 1%, while Marvell and Intel dropped more than 2% apiece.
Nvidia rose more than 3% and Meta jumped 6% on reporting that its artificial intelligence cost structure is improving, while Seoul's Kospi added 2.5% overnight on the listing halo. That distribution of firepower flatters the growth indices and leaves the price-weighted Dow watching from the sidewalk; the blue-chip index has slipped just under 1% this week against gains above 1% for the S&P 500 and Nasdaq Composite.
Strategist warnings making the rounds on Friday framed the chip complex as the market's new concentration risk and floated a second-half bust in the trade. With Micron up more than 200% year to date and several peers having doubled, the euphoria arithmetic is not subtle, and the Dow's relative dullness this week starts to look like a feature rather than a flaw.
A hawkish committee has removed the safety net
The rates backdrop offers no cushion under any of it. May's Consumer Price Index (CPI) ran 4.2% YoY, the June dot plot lifted the committee's median year-end projection to 3.8%, and futures markets now assign roughly a one-in-four probability to a hike at the July 28 to 29 meeting, with cuts effectively priced out of 2026.
Equities are grinding to records into a central bank that has abandoned its easing bias, which leaves the tape leaning entirely on earnings and artificial intelligence spending to justify each new high. That arrangement has worked so far; it also concentrates the downside into any single data point that hardens the hike case.
Tuesday holds the pin
June's US CPI lands Tuesday at 12:30 GMT, followed by two days of congressional testimony from the Fed chair at 14:00 GMT on Tuesday and Wednesday, producer prices on Wednesday, and retail sales on Thursday at 12:30 GMT. May's 4.2% headline was driven substantially by war-inflated energy costs, and June covers the weeks in which Hormuz flows recovered before seizing up again.
A hot print converts hike speculation into the base case and hands the record tape its first genuine test since April; a cool one buys the melt-up another fortnight. Either way, that number will move the Dow more than anything issued from Washington or Tehran this week has managed.
Dow Jones technical levels
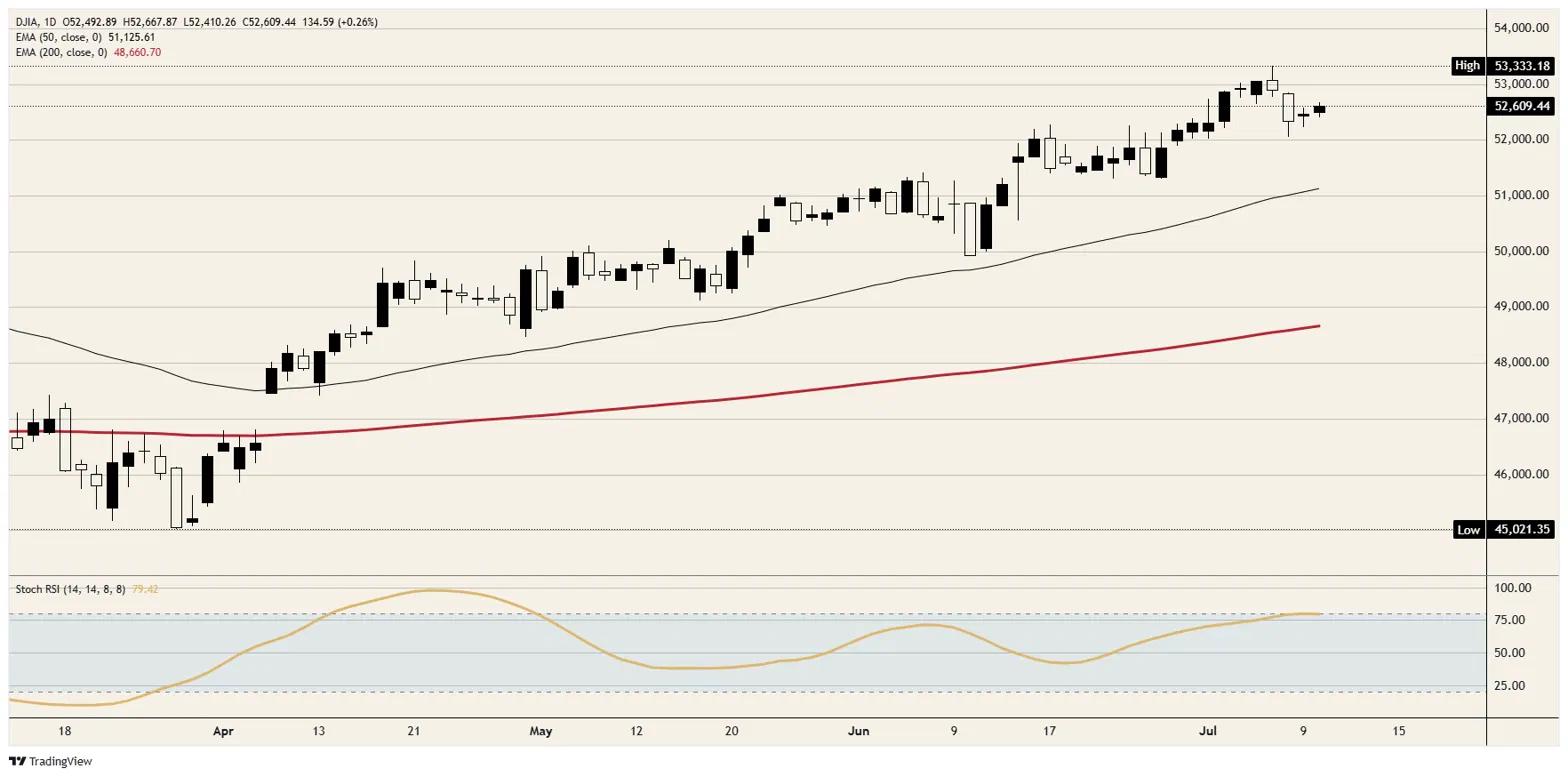
Resistance: Friday's high at 52,668 is the first hurdle, ahead of the 53,000 handle and Wednesday's record print at 53,333. The daily Stochastic Relative Strength Index is easing from overbought near 79, so a fresh push at the record needs a catalyst rather than momentum alone.
Support: The session low at 52,410 anchors the 52,400 shelf, with the 52,000 handle beneath it and the 50-day Exponential Moving Average far below at 51,126, a line the index has not tested since the April rebound.
Bias: Higher while 52,400 holds. The two-day stall reads as digestion rather than distribution, and a retest of 53,333 remains the path of least resistance into Tuesday's inflation print; a daily close below 52,400 is the first development that would change that call.
Dow Jones daily chart
Dow Jones FAQs
The Dow Jones Industrial Average, one of the oldest stock market indices in the world, is compiled of the 30 most traded stocks in the US. The index is price-weighted rather than weighted by capitalization. It is calculated by summing the prices of the constituent stocks and dividing them by a factor, currently 0.152. The index was founded by Charles Dow, who also founded the Wall Street Journal. In later years it has been criticized for not being broadly representative enough because it only tracks 30 conglomerates, unlike broader indices such as the S&P 500.
Many different factors drive the Dow Jones Industrial Average (DJIA). The aggregate performance of the component companies revealed in quarterly company earnings reports is the main one. US and global macroeconomic data also contributes as it impacts on investor sentiment. The level of interest rates, set by the Federal Reserve (Fed), also influences the DJIA as it affects the cost of credit, on which many corporations are heavily reliant. Therefore, inflation can be a major driver as well as other metrics which impact the Fed decisions.
Dow Theory is a method for identifying the primary trend of the stock market developed by Charles Dow. A key step is to compare the direction of the Dow Jones Industrial Average (DJIA) and the Dow Jones Transportation Average (DJTA) and only follow trends where both are moving in the same direction. Volume is a confirmatory criteria. The theory uses elements of peak and trough analysis. Dow’s theory posits three trend phases: accumulation, when smart money starts buying or selling; public participation, when the wider public joins in; and distribution, when the smart money exits.
There are a number of ways to trade the DJIA. One is to use ETFs which allow investors to trade the DJIA as a single security, rather than having to buy shares in all 30 constituent companies. A leading example is the SPDR Dow Jones Industrial Average ETF (DIA). DJIA futures contracts enable traders to speculate on the future value of the index and Options provide the right, but not the obligation, to buy or sell the index at a predetermined price in the future. Mutual funds enable investors to buy a share of a diversified portfolio of DJIA stocks thus providing exposure to the overall index.














