
Ethereum Price Forecast: ETH could see a 30% decline if history repeats
작성자 Michael Ebiekutan
수정됨: 24 Jun 2026


인기 기사

Ethereum (ETH) has fallen toward the $1,600 level, down over 3% on Wednesday as risk-off signs persist across key onchain metrics.
Ethereum price today: $1,615
- The ETH Realized Price Lower Band suggests the top altcoin could decline by 30% before establishing a bottom.
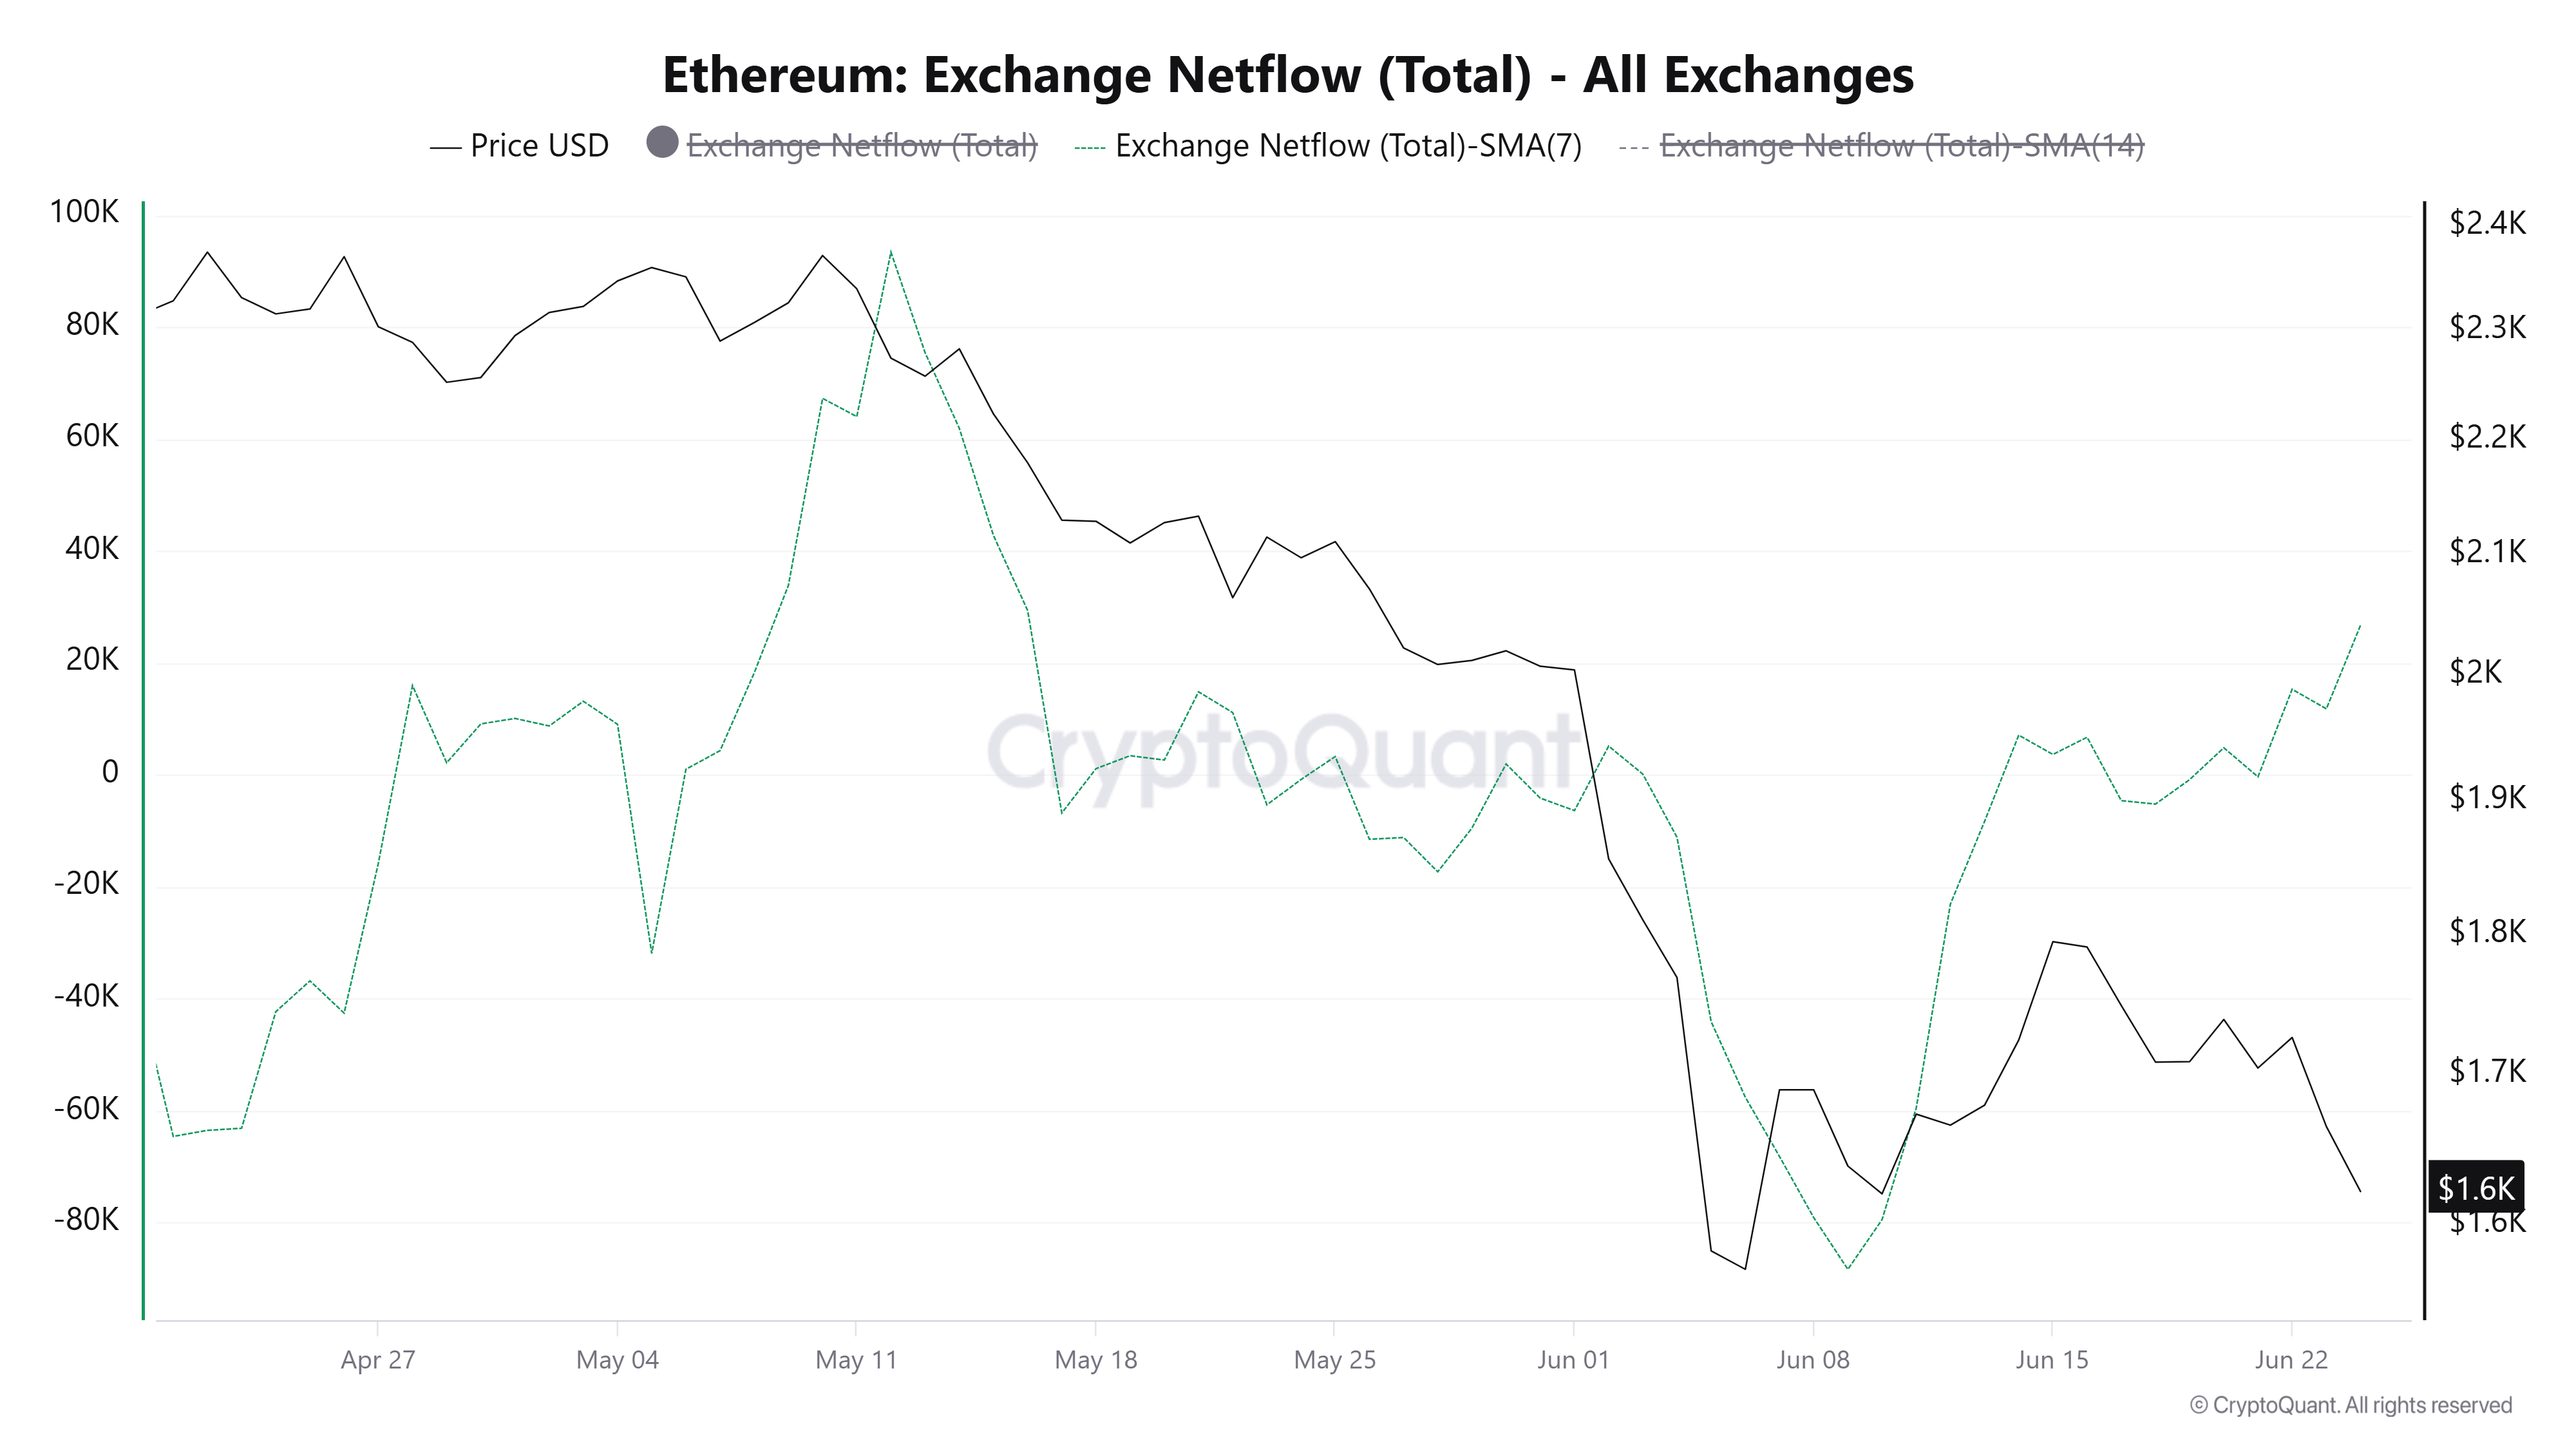
- The market remains slightly tilted toward the downside, with rising net exchange flows and sustained spot ETH ETF outflows.
- ETH could bounce off the $1,611 support level.
Ethereum (ETH) has fallen toward the $1,600 level, down over 3% on Wednesday as risk-off signs persist across key onchain metrics.
The ETH Realized Price Lower Band, which has historically marked bear market bottoms for the top altcoin, suggests ETH has room for further downside before staging a proper upward move.
In the 2018 and 2022 bear markets, ETH established a bottom near the Realized Price Lower Band after seeing a correction from its Upper Band in prior bull markets. Last October, ETH began a major market correction after nearing the Upper Band, but it has yet to reach the Lower Band since then, despite declining by more than 65%.
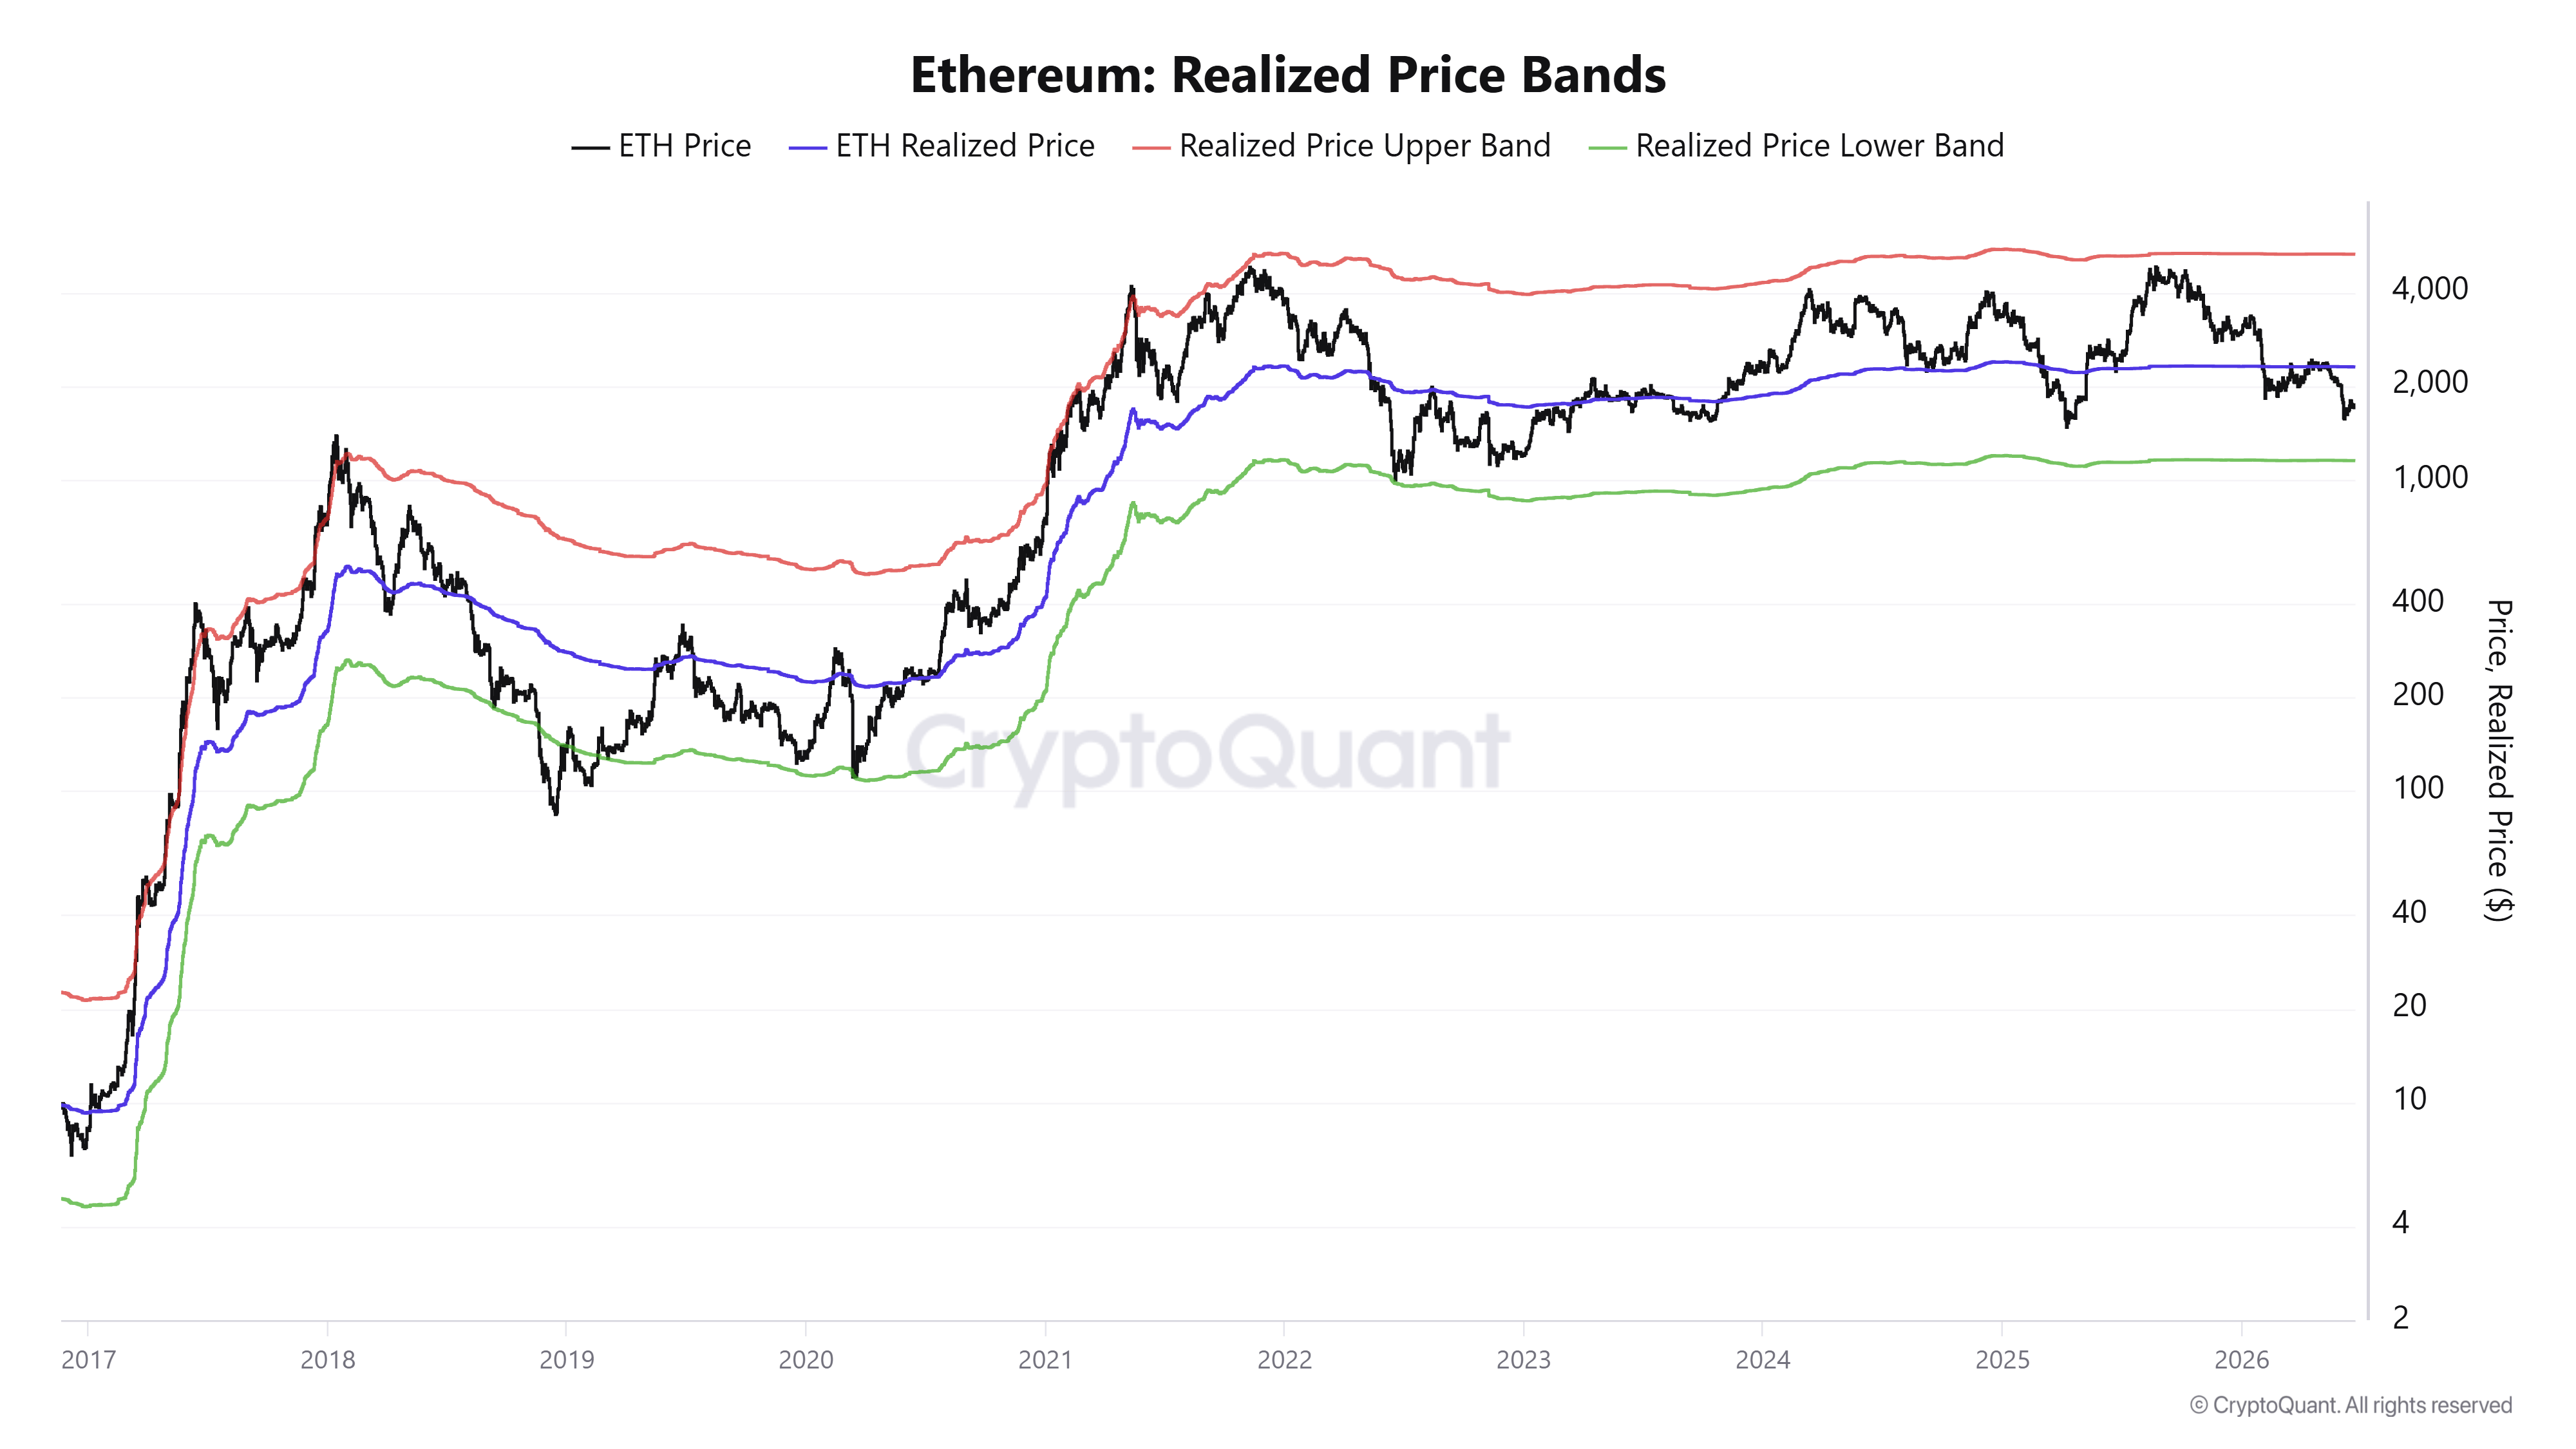
The ETH Realized Price Lower Band is currently near $1,150, meaning the top altcoin may have to sustain a further 30% decline from current levels before establishing a bottom — that is, if the metric proves to be correct again. Historically, after establishing a bottom, ETH has to clear the Realized Price — or the average onchain cost basis of investors — resistance before staging a proper rally.
The current market environment indicates a directional bias slightly tilted toward the downside in spot markets, as ETH exchange net flows have been slowly climbing over the past two weeks.
Similarly, US spot ETH exchange-traded funds (ETFs) have continued to post negative flows, recording $82.3 million in outflows on Tuesday, according to SoSoValue data. The products are on track to record seven consecutive weeks of outflows if the decline persists in the next two days.
Ethereum Price Forecast: ETH could bounce off $1,611 support
Ethereum has recorded $213 million in liquidations over the past 24 hours, led by $170.4 million in liquidated long positions, per SoSoValue data.
On the daily chart, ETH is extending a bearish phase, with price holding below the 20-, 50- and 100-day Exponential Moving Averages (EMAs), clustered between roughly $1,740 and $2,050. This configuration keeps the broader tone pressured despite deeply oversold readings, as the Relative Strength Index (RSI) hovers near 34 and the Stochastic sinks into extreme oversold territory, hinting that while downside momentum persists, the pace of the decline could soon moderate rather than decisively reverse.
On the topside, immediate resistance is located at the convergence of the horizontal barrier at $1,741 and the 20-day EMA. Further hurdles are at $1,806, followed by a thicker supply zone between the $1,909 horizontal cap and the 50-day EMA at $1,890.
If sellers double down, initial support is seen near $1,611 ahead of $1,524, with a stronger floor at $1,404. A break there would expose the deeper support region around $1,156.
(The technical analysis of this story was written with the help of an AI tool.)

100만 명이 넘는 사용자가 FXStreet를 통해 실시간 시장 데이터, 차트 도구, 전문가 인사이트, 포렉스 뉴스를 이용합니다. 포괄적인 경제 캘린더와 교육 웨비나는 트레이더가 정보를 유지하고 신중한 결정을 내리도록 돕습니다. FXStreet는 바르셀로나 본사와 전 세계 지역에 걸쳐 약 60명의 팀으로 구성되어 있습니다.
더 읽기


