
Ethereum Price Forecast: ETH hit the hardest as inflation and Treasury yields weigh on crypto market
작성자 Michael Ebiekutan
수정됨: 19 May 2026


인기 기사

Ethereum (ETH) is hovering around $2,110, up 0.5% on Tuesday after facing strong selling pressure over the past week. The top altcoin declined from above $2,300 after retail wallet distributions.
Ethereum price today: $2,110
- ETH and the broader crypto market face major sell-offs as rising inflation and Treasury yields pressure risk assets.
- Ethereum was hit the hardest, declining more than 10% and incurring more than $700 million in long liquidations over the past week.
- ETH is retesting the $2,108 support level amid persistent downside risk.
Ethereum (ETH) is hovering around $2,110, up 0.5% on Tuesday after facing strong selling pressure over the past week. The top altcoin declined from above $2,300 after retail wallet distributions.
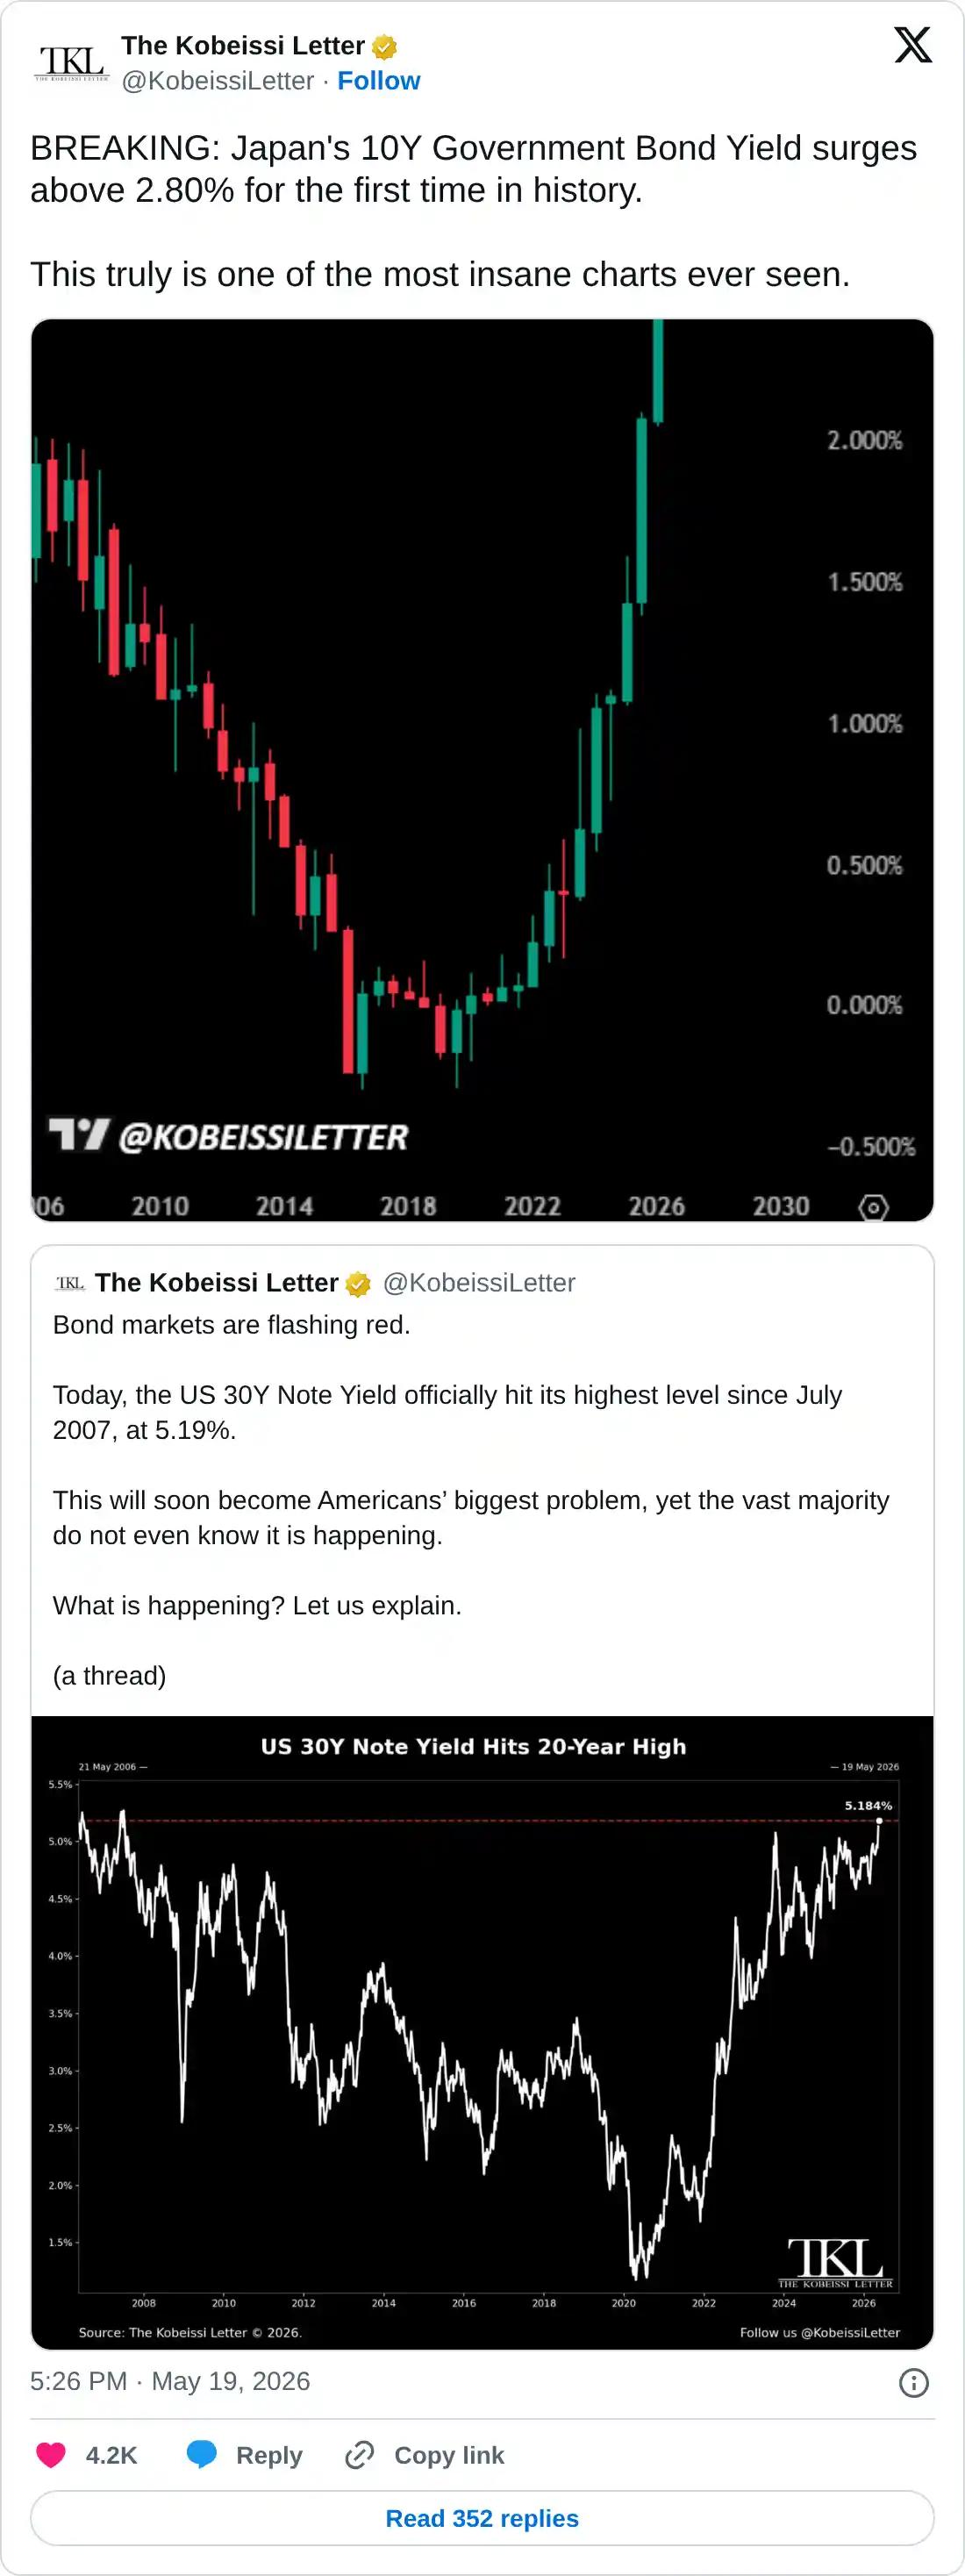
The distribution wasn't peculiar to ETH, as several top cryptos witnessed major sell-offs following soaring inflation and rising US Treasury yields. The US 30Y Note Yield reached 5.19%, offsetting the slight cooldown from its Trump tariff-led rise last year. That represents its highest level since 2007.
Similarly, Japan's 10Y Government Bond Yield surged to a record high of 2.81%. Historically, risk assets like cryptocurrencies have performed poorly when treasury yields are rising, as this signals higher borrowing costs, often pushing investors toward safer, income-generating government bonds.
While the impact has been felt across the crypto market, ETH appears to have been hit the hardest, suffering a more than 10% decline and incurring more than $700 million in long liquidations over the past week, outpacing Bitcoin's upside liquidations, according to Coinglass data. The move aligns with earlier signs of a long squeeze noticed in the ETH derivatives market.
Onchain records paint a similar picture. Wallets with a balance of 100-1K and 1K-10K ETH offloaded a combined 386K ETH between May 11-18, maintaining a distribution pattern that has been consistent over the past few months.
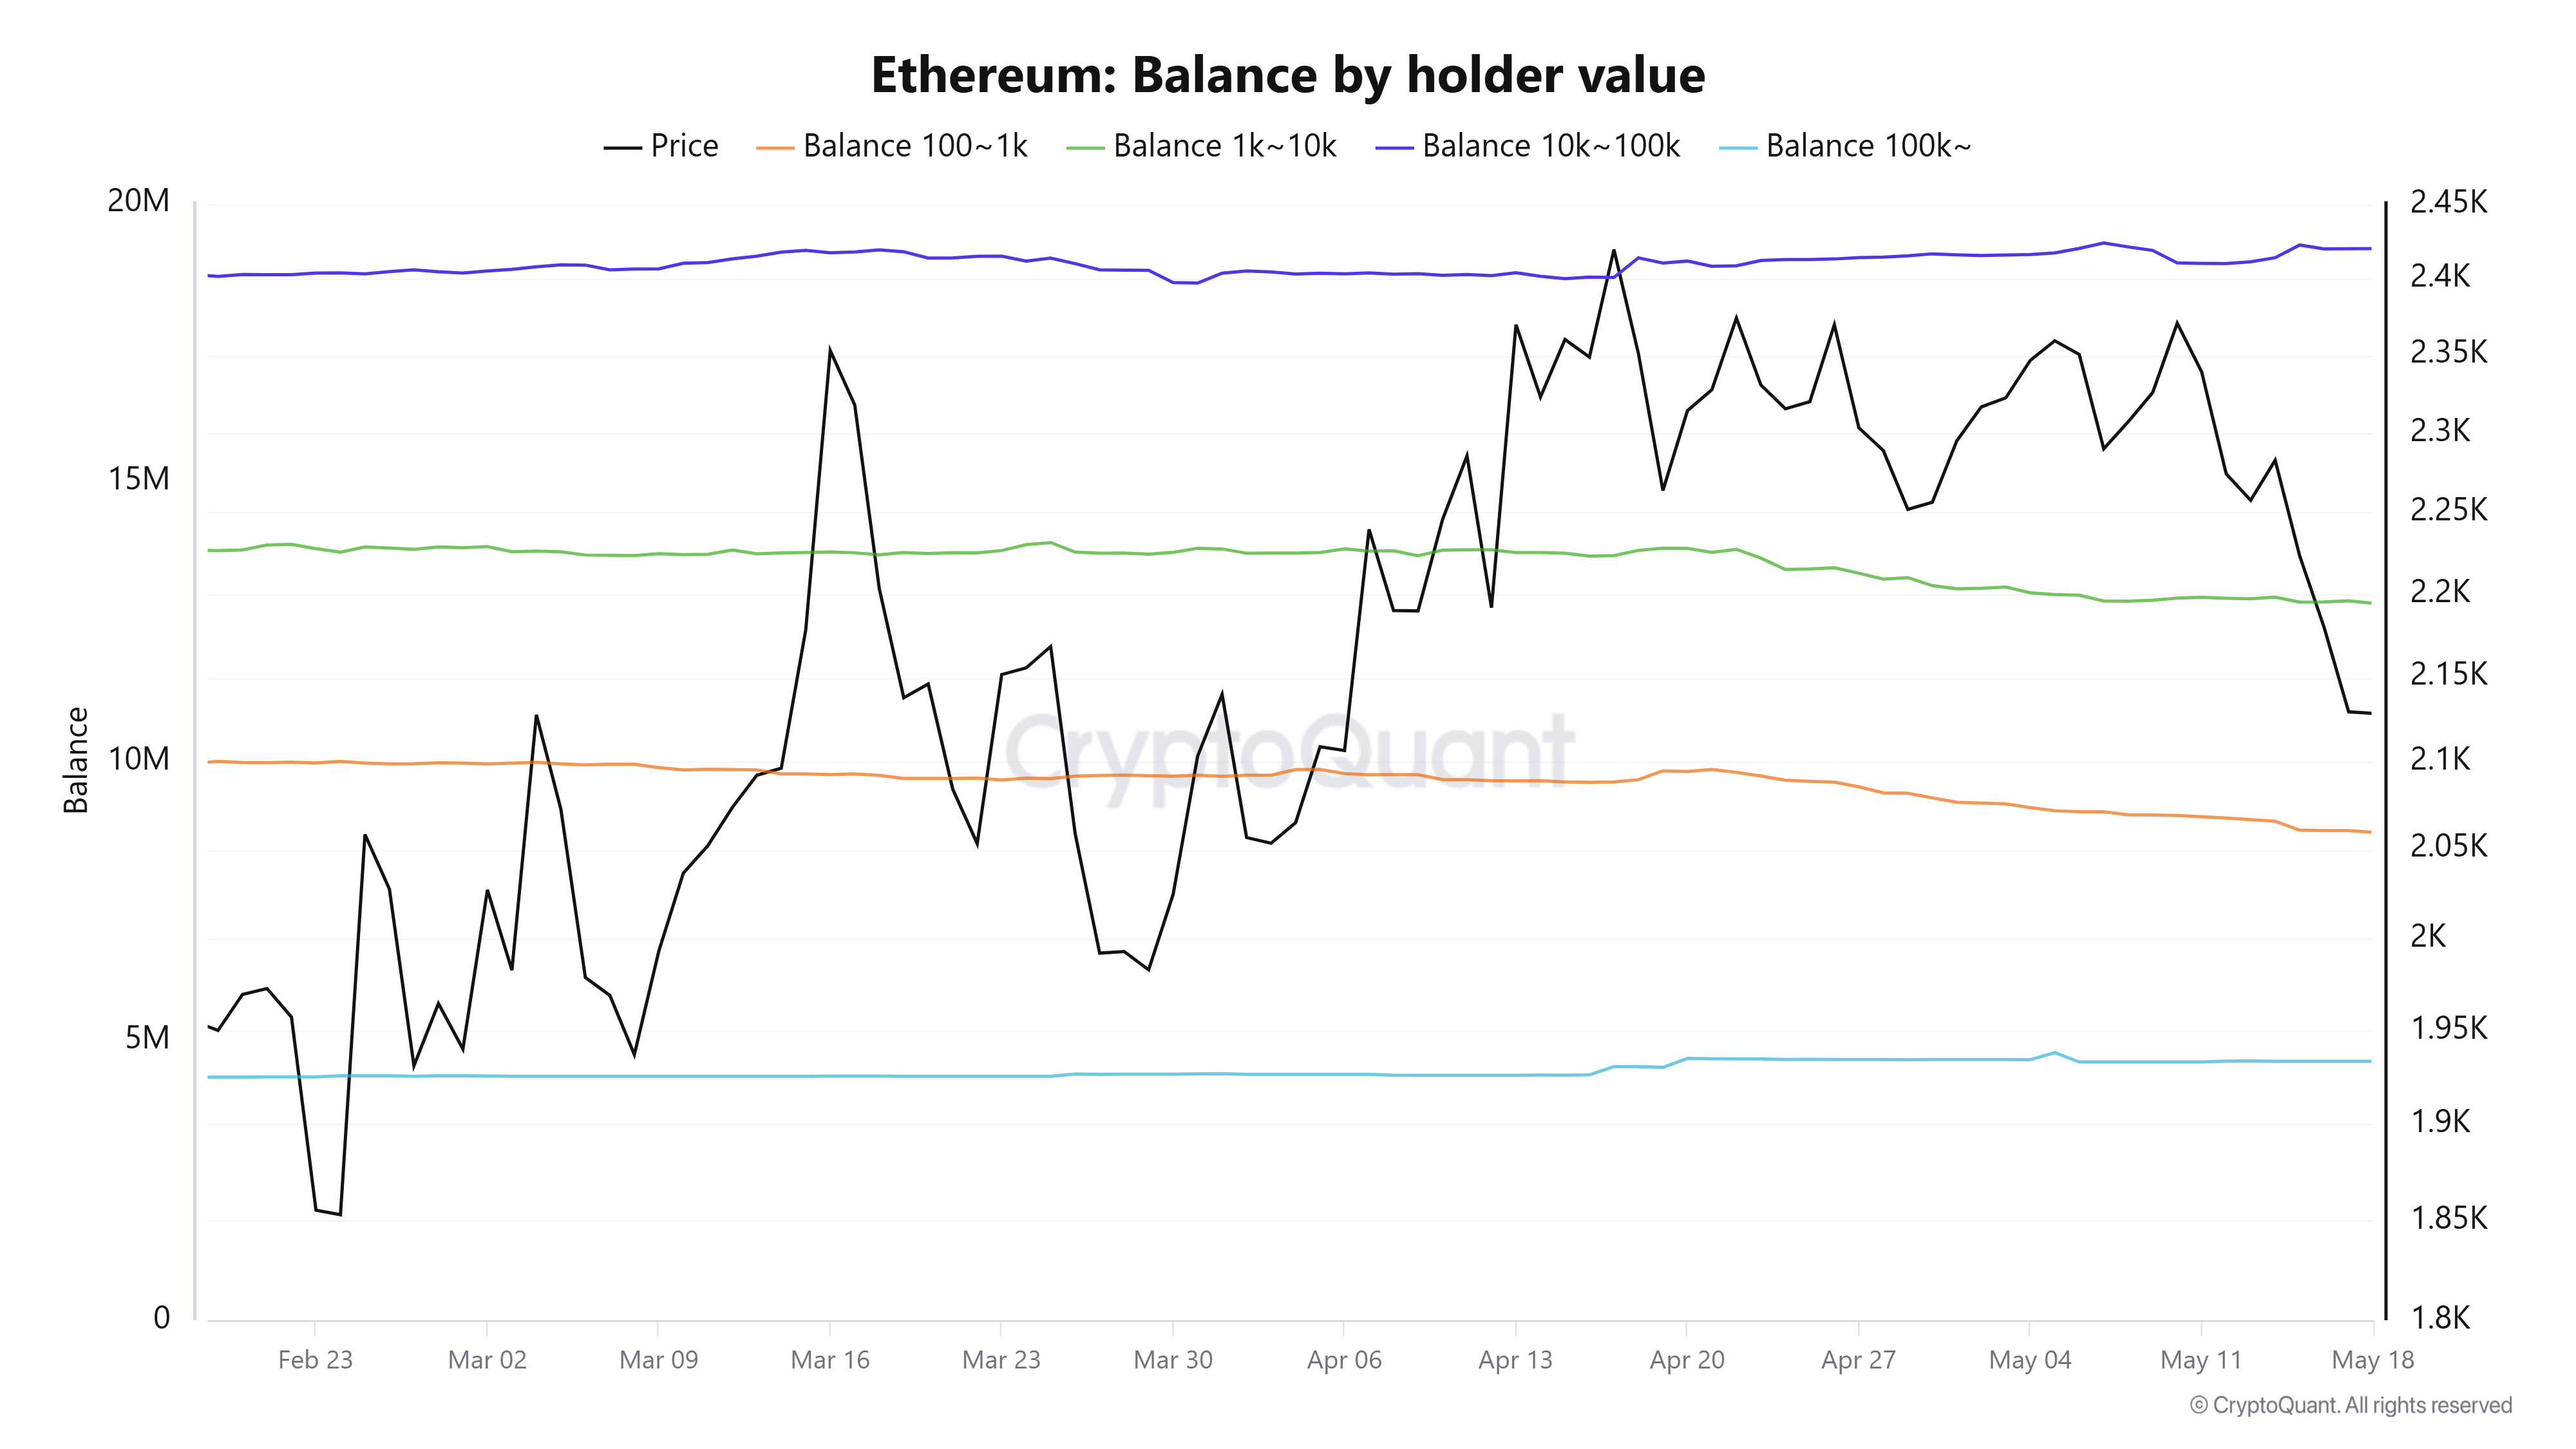
During the same period, whales accumulated 330K ETH earlier, pouncing on the price dip, but eventually tapered that figure by 60K ETH over the past few days.
Ethereum Price Forecast: ETH retests $2,108 support amid lingering downside risk
On the daily chart, ETH trades near $2,110, extending a bearish near-term tone as price holds beneath the 20-, 50- and 100-day Exponential Moving Averages (EMAs), which are clustered from roughly $2,245 to $2,333. This alignment of overhead EMAs suggests rallies are likely to face resistance while downside risks persist.
This view is reinforced by the Relative Strength Index (RSI) hovering near 34 and the Stochastic Oscillator (Stoch) around 12, both indicating lingering downside momentum rather than an immediate reversal setup.
On the topside, initial resistance is located at the horizontal barrier at $2,211. A break above this zone would expose the 20-day EMA at $2,245 and the 50-day EMA at $2,253, with the 100-day EMA at $2,333 and the $2,389 level acting as subsequent caps.
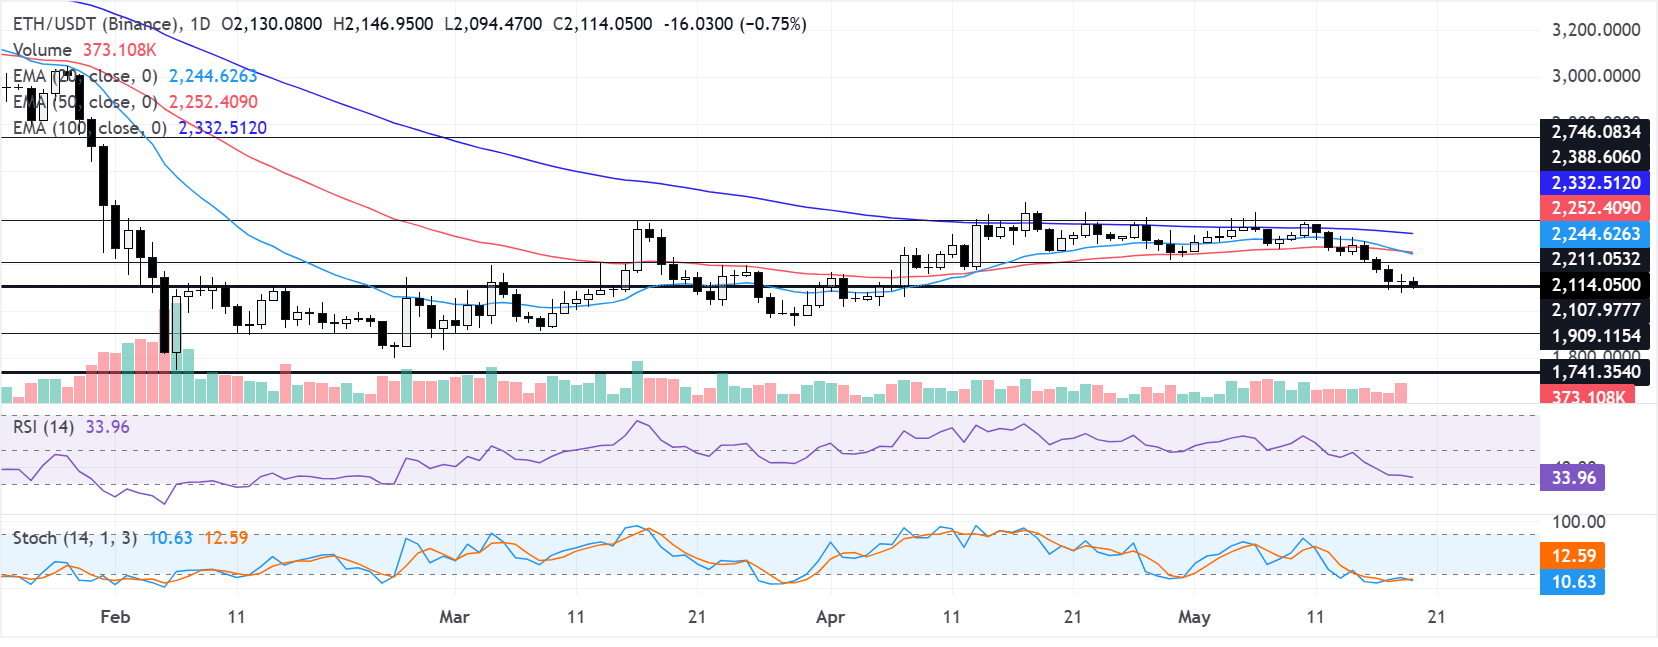
On the downside, immediate support is seen at the horizontal line around $2,108, ahead of a stronger floor near $1,909. A failure there could open the way toward $1,741, before deeper supports at $1,524 and $1,405 come into view.
(The technical analysis of this story was written with the help of an AI tool.)

100만 명이 넘는 사용자가 FXStreet를 통해 실시간 시장 데이터, 차트 도구, 전문가 인사이트, 포렉스 뉴스를 이용합니다. 포괄적인 경제 캘린더와 교육 웨비나는 트레이더가 정보를 유지하고 신중한 결정을 내리도록 돕습니다. FXStreet는 바르셀로나 본사와 전 세계 지역에 걸쳐 약 60명의 팀으로 구성되어 있습니다.
더 읽기


