
Ethereum Price Forecast: ETH shorts decrease amid rising liquidations
작성자 Michael Ebiekutan
게시일: 18 Dec 2025 | 수정일: 18 Dec 2025


인기 기사

Ethereum (ETH) shorts have been steadily decreasing over the past few weeks following the October 10 leverage flush.
Ethereum price today: $2,830
- Ethereum's short open interest has contracted in the past few weeks following the October 10 crash.
- ETH exchange reserves have declined to their lowest level since 2016.
- ETH could fall to $2,626 if it fails to bounce at the symmetrical triangle support.
Ethereum (ETH) shorts have been steadily decreasing over the past few weeks following the October 10 leverage flush.
The total open interest of ETH short positions on the CME has contracted from about $5 billion in October to $2.36 billion. The sustained price decline over the past few weeks has potentially prompted most short traders to cover their positions. Open interest is the total worth of unsettled contracts in a derivatives market.
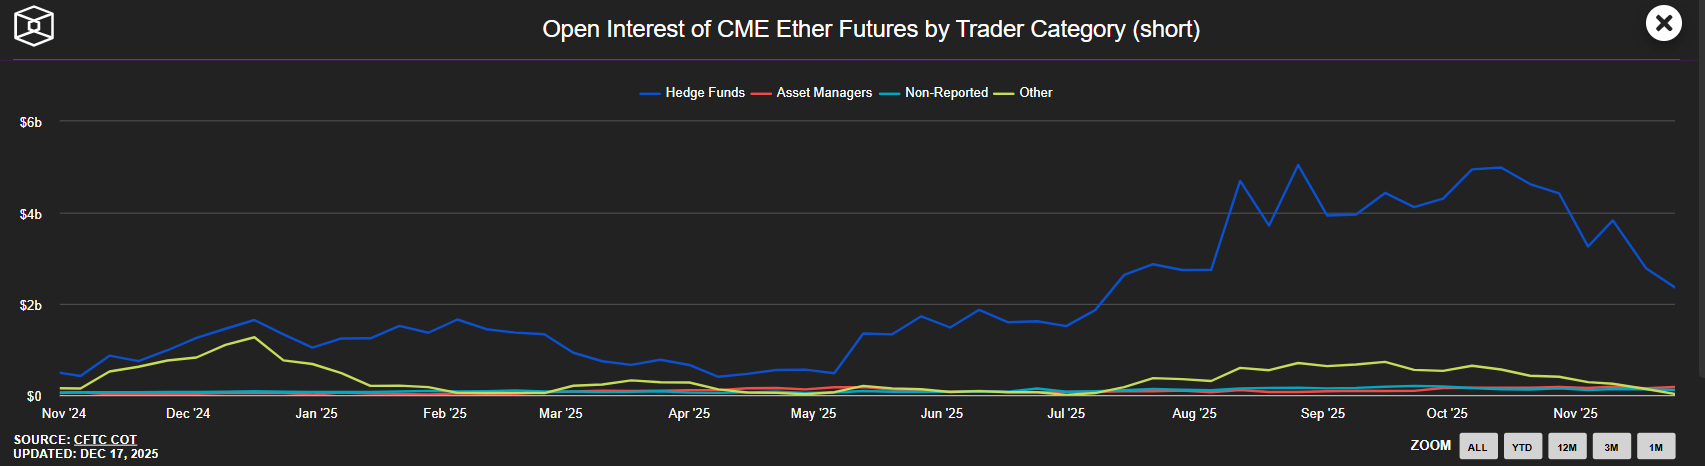
A similar trend is evident in the Binance ETH Net Taker Volume, which tracks the difference between buyers and sellers purchasing ETH contracts using market orders. The volume has scaled back from -$570 million in September to about $108 million as of December 16.
The continued reduction in shorts implies less selling pressure on ETH, easing downside risk.
Buying momentum leads on ETH spot markets
On the spot side, Ethereum exchange reserve, which measures the total number of coins held in exchanges, has fallen to 16.2 million ETH — its lowest level since 2016.
-1766003195918-1766003195918.png)
Most of these coins have flowed into the wallets of whales holding 10K-100K ETH. Their cumulative holdings have increased by 2.85 million ETH between October and December, highlighting a strong buy-the-dip attitude from this cohort.
Ethereum Price Forecast: ETH tests symmetrical triangle support
Ethereum experienced $114.5 million in liquidations over the past 24 hours, driven by $110.8 million in long liquidations, according to Coinglass data.
ETH is testing the lower boundary of a symmetrical triangle on Wednesday after seeing a rejection near the 20-day Exponential Moving Average (EMA).
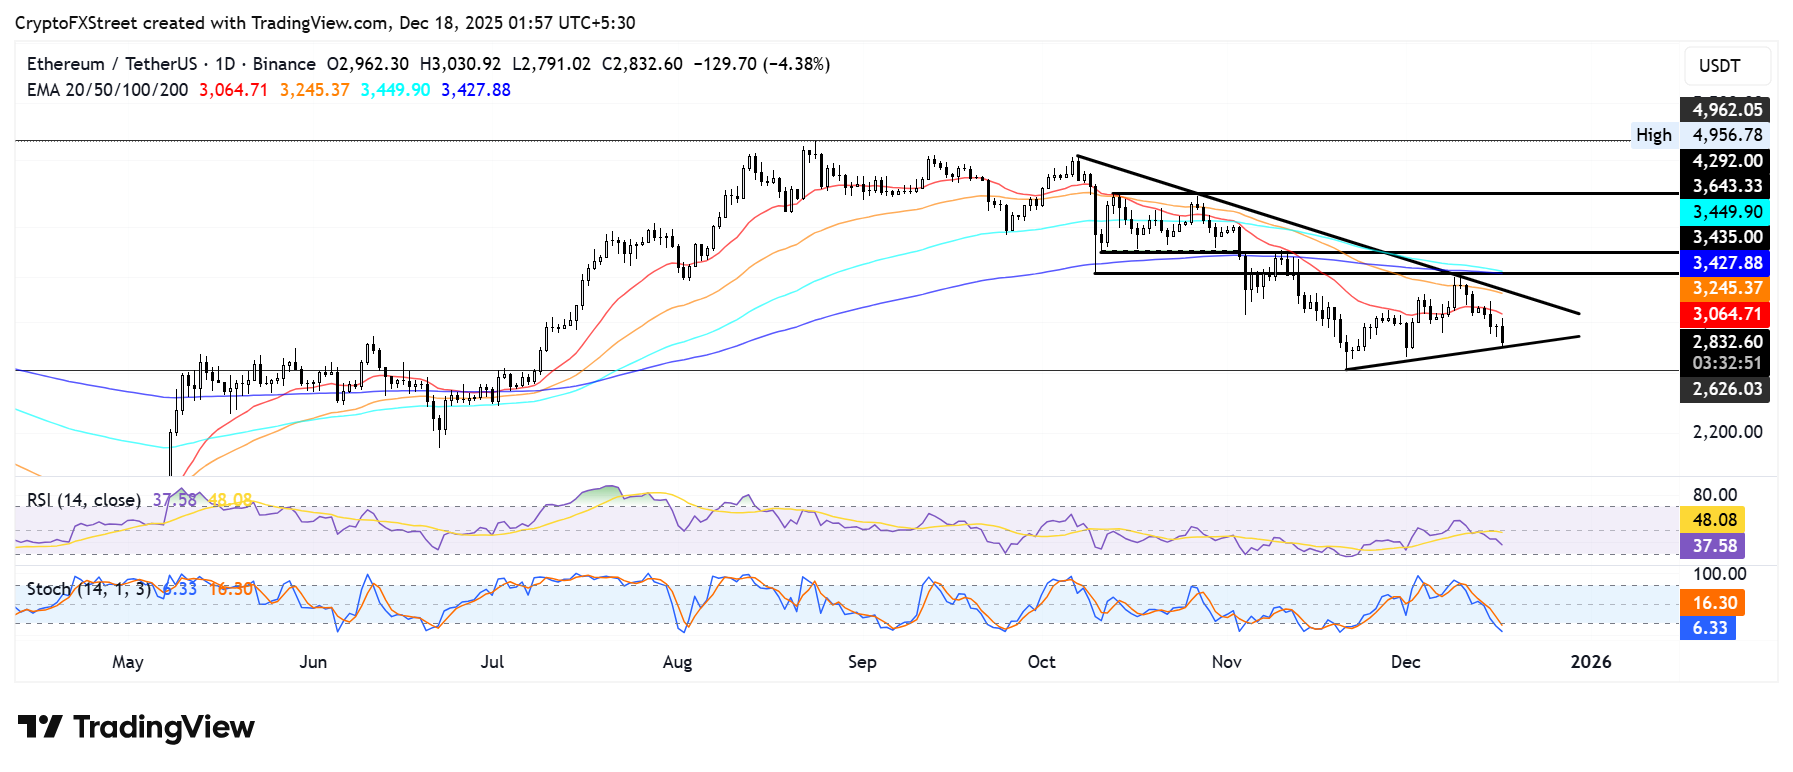
If ETH holds the triangle's support, it could retest the 20-day EMA. A rise above could see ETH test the triangle's upper boundary near the 50-day EMA.
On the downside, ETH could find support around $2,626 if it falls below the triangle's lower boundary.
The Relative Strength Index (RSI) continues to trend lower below its neutral level, while the Stochastic Oscillator (Stoch) remains in oversold conditions. The move signals rising bearish momentum, but there's potential for a reversal given the Stoch's oversold condition.

100만 명이 넘는 사용자가 FXStreet를 통해 실시간 시장 데이터, 차트 도구, 전문가 인사이트, 포렉스 뉴스를 이용합니다. 포괄적인 경제 캘린더와 교육 웨비나는 트레이더가 정보를 유지하고 신중한 결정을 내리도록 돕습니다. FXStreet는 바르셀로나 본사와 전 세계 지역에 걸쳐 약 60명의 팀으로 구성되어 있습니다.
더 읽기


