
Ethereum Price Forecast: ETH's rise above $2,300 not yet backed by robust demand
작성자 Michael Ebiekutan
수정됨: 16 Apr 2026


인기 기사

Ethereum (ETH) quickly reclaimed $2,300 again on Thursday after a slight dip below the level in the early American session.
Ethereum price today: $2,350
- Ethereum holders across whale and retail cohorts are showing signs of distribution after prices approached their average cost basis.
- Capital inflows into ETH derivatives have also eased after the price jump above $2,300.
- Bulls are struggling to break above the convergence of the 100-day EMA and $2,388 resistance.
Ethereum (ETH) quickly reclaimed $2,300 again on Thursday after a slight dip below the level in the early American session.
The top altcoin has been facing pressure near $2,380, which aligns with a key technical resistance and is close to its realized price or onchain average cost basis of investors.
Particularly, that level is sandwiched between the cost basis of two cohorts, wallets with a balance of 10K-100K ETH and 1K-10K ETH at $2,324 and $2,436, respectively.
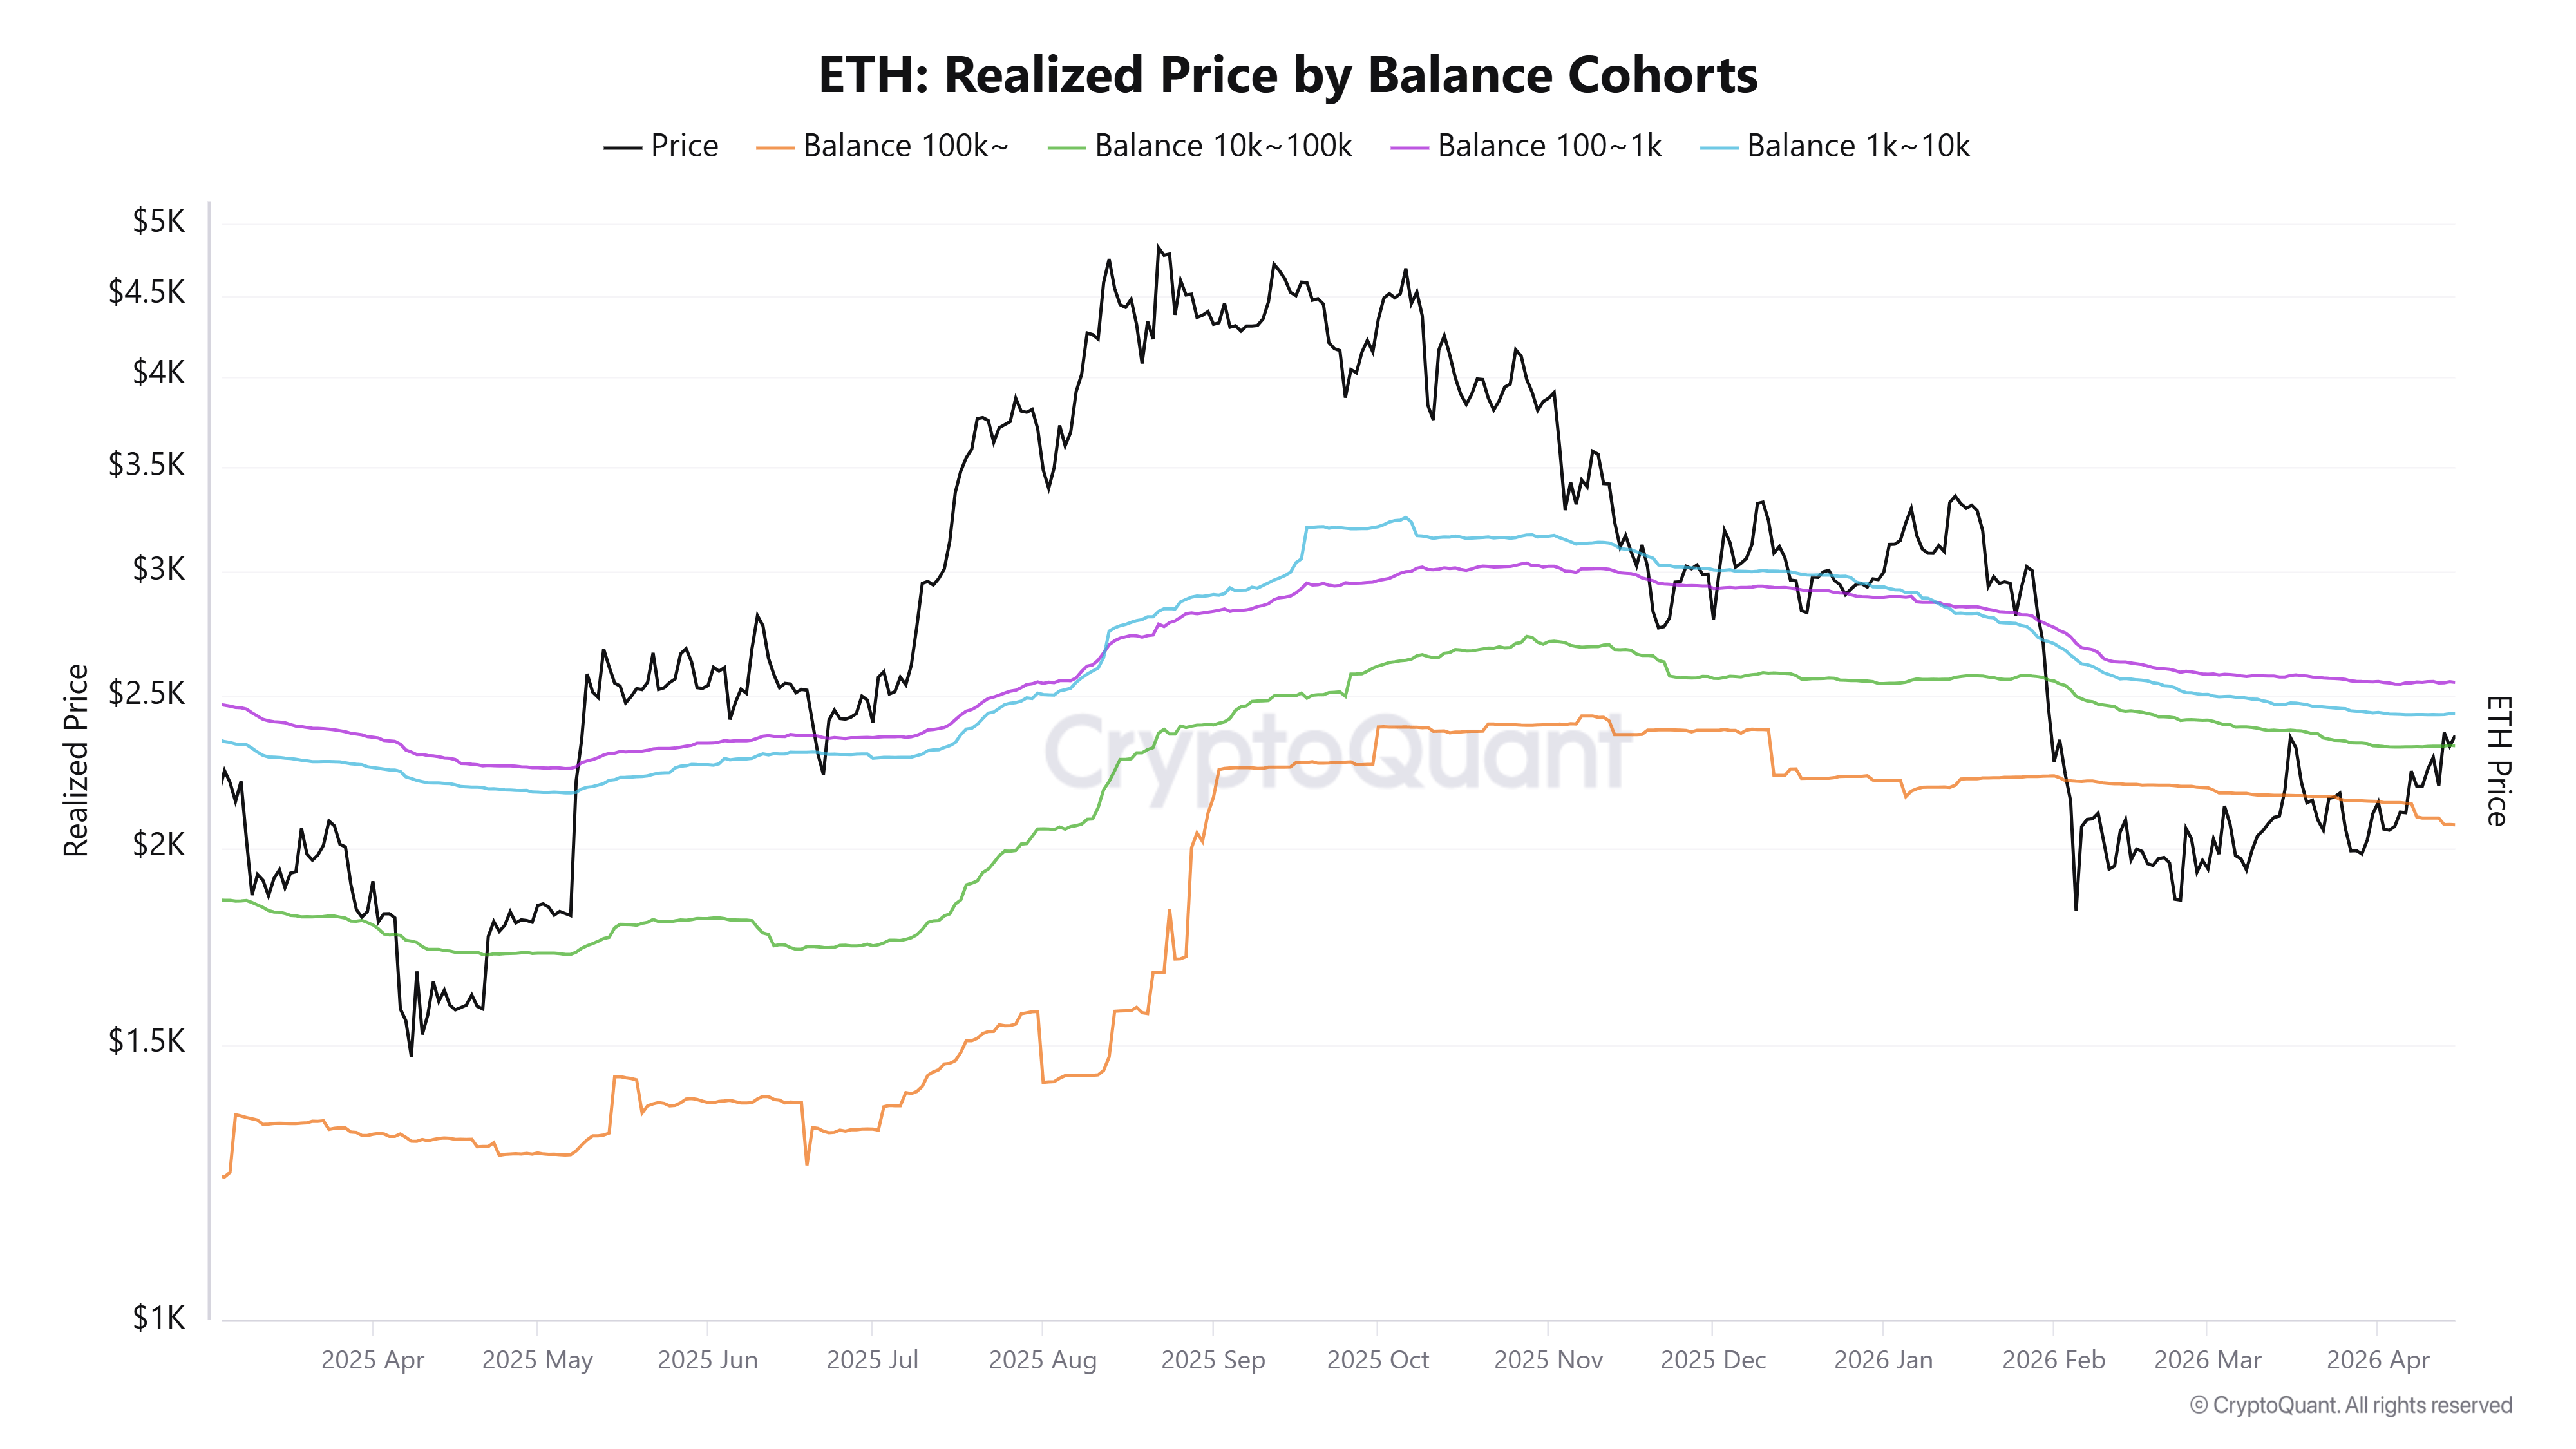
The former cohort, also known as whale wallets, has shown signs of distribution after prices climbed above their cost basis on Monday, offloading just 60K ETH since then. Such movements often flow from investors who are looking to walk away after their holdings break even.
While outflows have eased in wallets holding 100-1K and 1K-10K ETH over the past three days, both cohorts have distributed roughly 350K ETH on the weekly timeframe.
A similar sentiment is evident in capital inflows into Ethereum futures, which have stalled over the past few days. Open interest, or the total value of outstanding contracts in ETH derivatives, has hovered around 14.2 million ETH since the price jump on Monday and has failed to expand further, per Coinglass data.
The seven-day moving average of the Taker Buy-Sell Ratio has also begun to decline, indicating that derivatives interest is slowing.
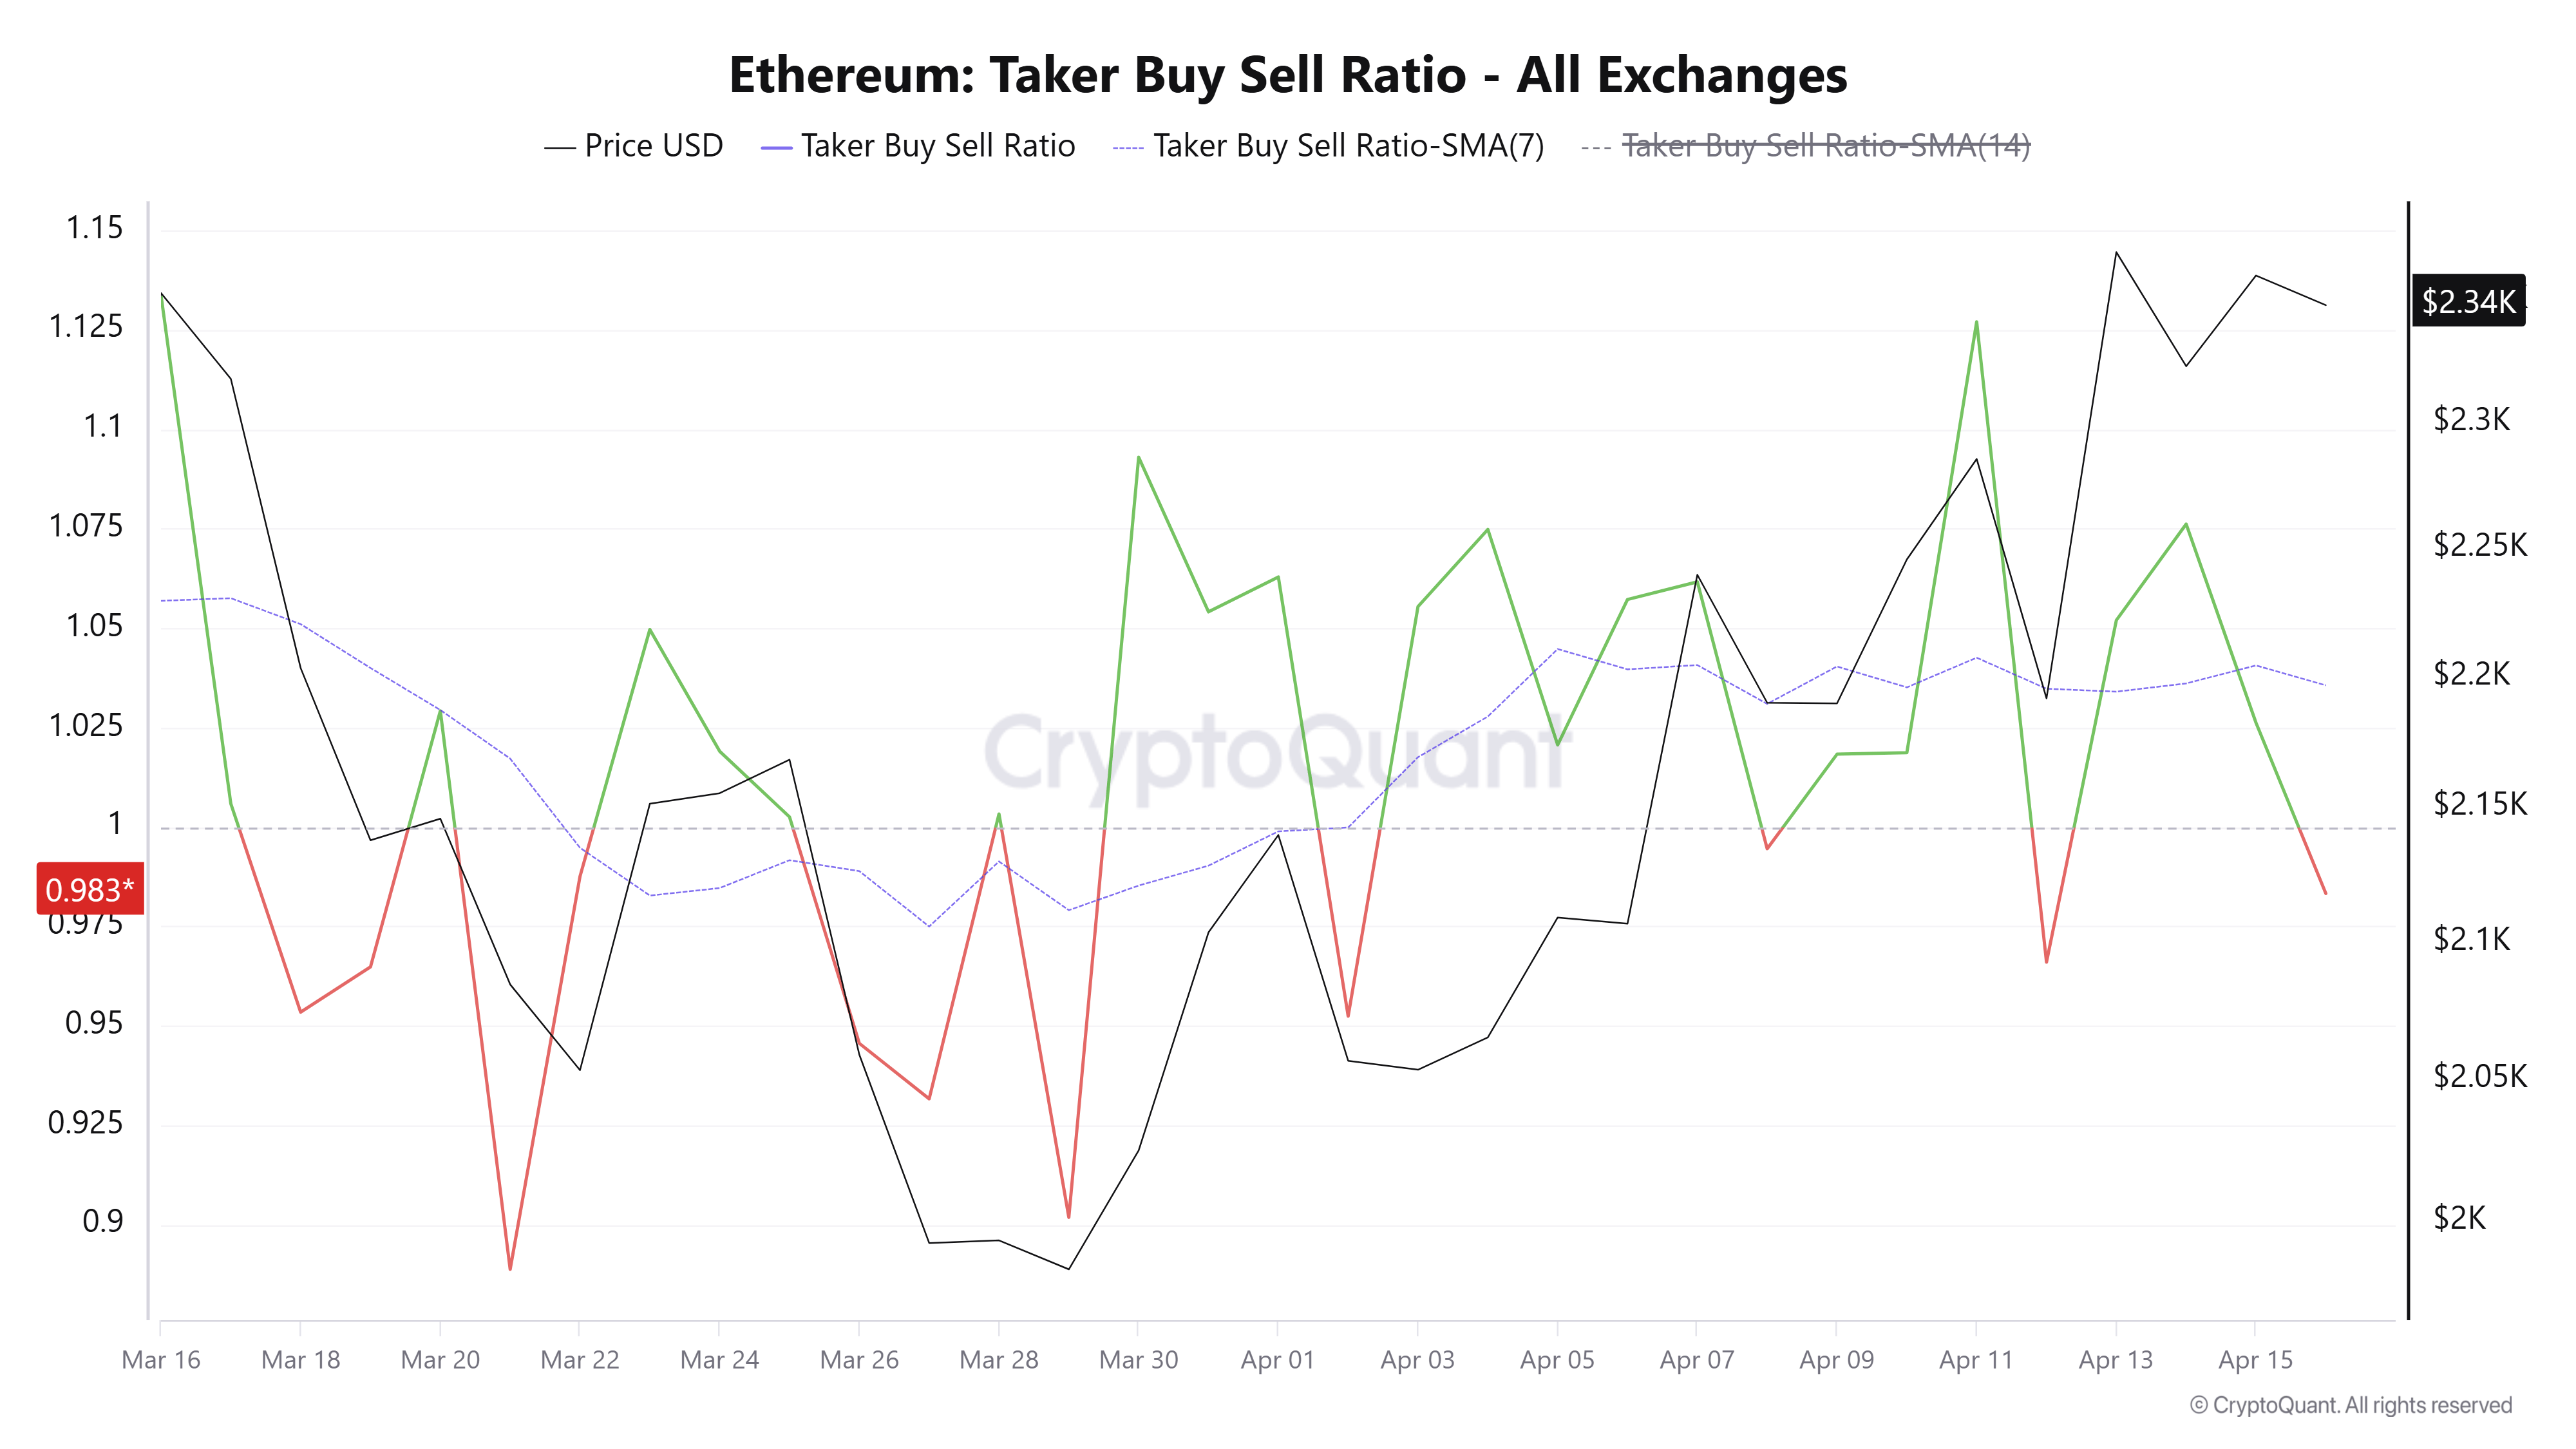
The Taker Buy-Sell Ratio measures the difference in buying and selling volumes of traders using market orders to purchase ETH perpetual futures contracts. An uptick indicates that long orders are dominating, and a downtick indicates the opposite.
However, US spot ETH exchange-traded funds (ETFs) have registered five consecutive days of net inflows after pulling in $67.8 million on Wednesday, indicating institutional demand is returning but at a slow pace, according to SoSoValue data.
A combination of these metrics indicates that the current rise above $2,300 is not yet backed by robust demand.
Ethereum Price Forecast: Bulls battle supply pressure at 100-day EMA and $2,388 convergence
Ethereum has seen $111.6 million in liquidations over the past 24 hours, led by $70.8 million in long liquidations, per Coinglass data.
In the daily chart, ETH trades at $2,351, maintaining a constructive bullish tone as it holds above the 20- and 50-day Exponential Moving Averages (EMAs) at $2,214 and $2,190, respectively.
Upside momentum is supported by the Relative Strength Index (RSI) hovering around 61, while the Stochastic Oscillator (Stoch) near 84 signals overbought conditions that could slow the advance, especially as price approaches the 100-day EMA at $2,376, which now acts as immediate resistance ahead of the horizontal barrier at $2,388. A daily close above this resistance would open the way to $2,746 and then $3,411.
On the downside, initial support emerges at the convergence of the 20- and 50-day EMAs and the horizontal level at $2,211, while a deeper pullback would bring $2,107 and $1,909 into view before the more distant supports at $1,741 and $1,404.
(The technical analysis of this story was written with the help of an AI tool.)

100만 명이 넘는 사용자가 FXStreet를 통해 실시간 시장 데이터, 차트 도구, 전문가 인사이트, 포렉스 뉴스를 이용합니다. 포괄적인 경제 캘린더와 교육 웨비나는 트레이더가 정보를 유지하고 신중한 결정을 내리도록 돕습니다. FXStreet는 바르셀로나 본사와 전 세계 지역에 걸쳐 약 60명의 팀으로 구성되어 있습니다.
더 읽기


