
Ethereum Price Forecast: Spot selling pressures ETH, but dip-buying could provide support
작성자 Michael Ebiekutan
수정됨: 13 May 2026


인기 기사

Ethereum (ETH) is facing increasing selling pressure on the spot side following signs of cracks in US-Iran peace talks. With Oil prices surging higher, the top altcoin has failed to recover the $2,300 key level on Wednesday.
Ethereum price today: $2,260
- Ethereum exchange reserves rose by 623K ETH over the past week, signaling an increase in selling pressure.
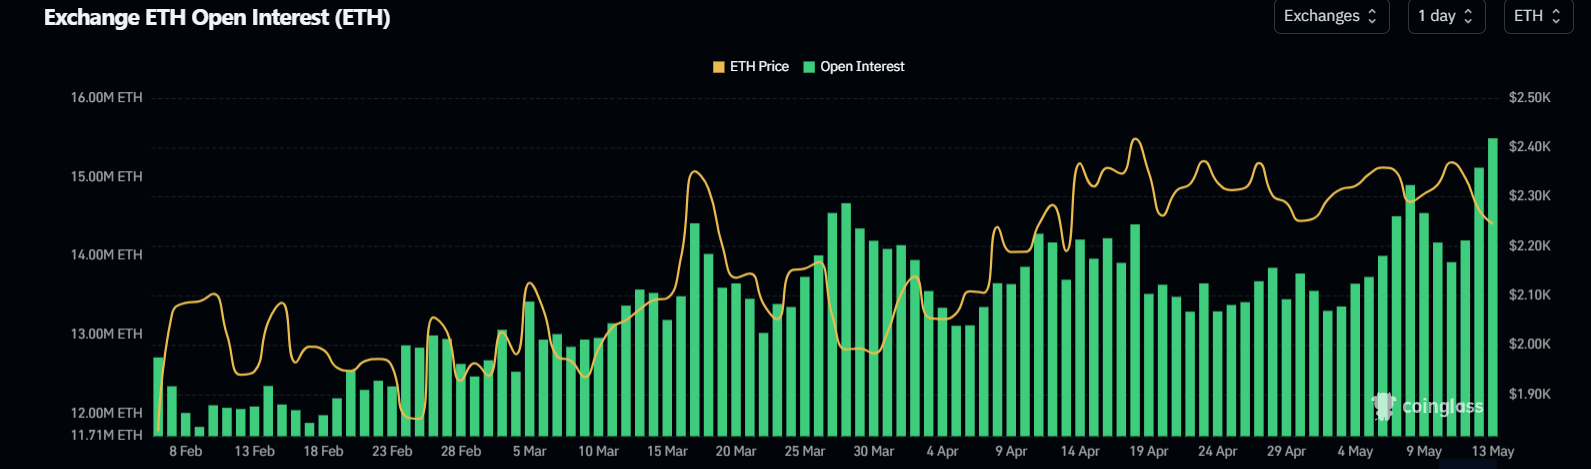
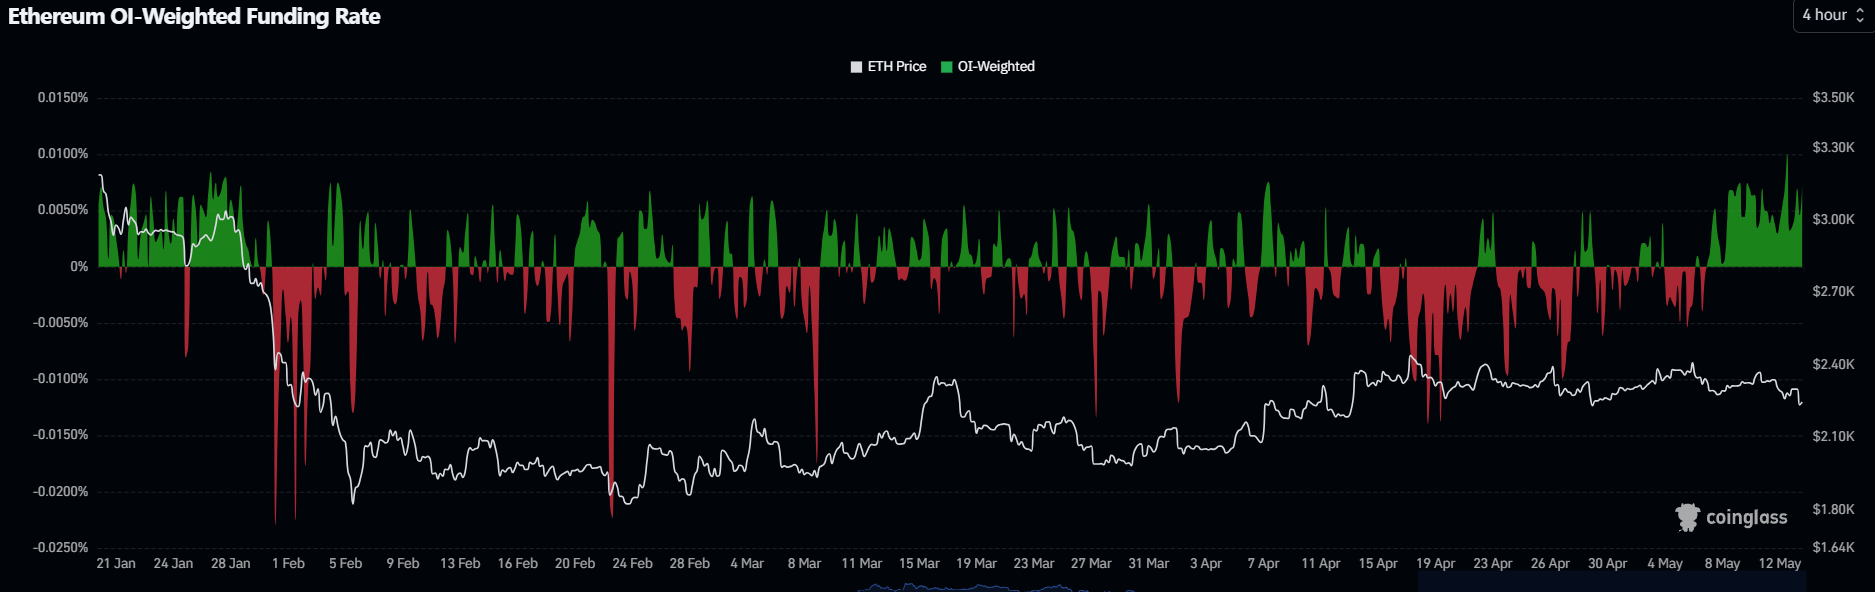
- Open interest climbed to a record 15.5 million ETH while funding rates posted their longest positive streak since January, indicating dip-buying from derivatives traders.
- ETH breaks below the 50-day EMA as it approaches the $2,211 support.
Ethereum (ETH) is facing increasing selling pressure on the spot side following signs of cracks in US-Iran peace talks. With Oil prices surging higher, the top altcoin has failed to recover the $2,300 key level on Wednesday.
Exchange reserves, which measure the total number of coins held across centralized exchanges, have been on an uptrend over the past week, rising by 623K ETH from May 5 to 13. The move indicates increased selling pressure across ETH spot markets.
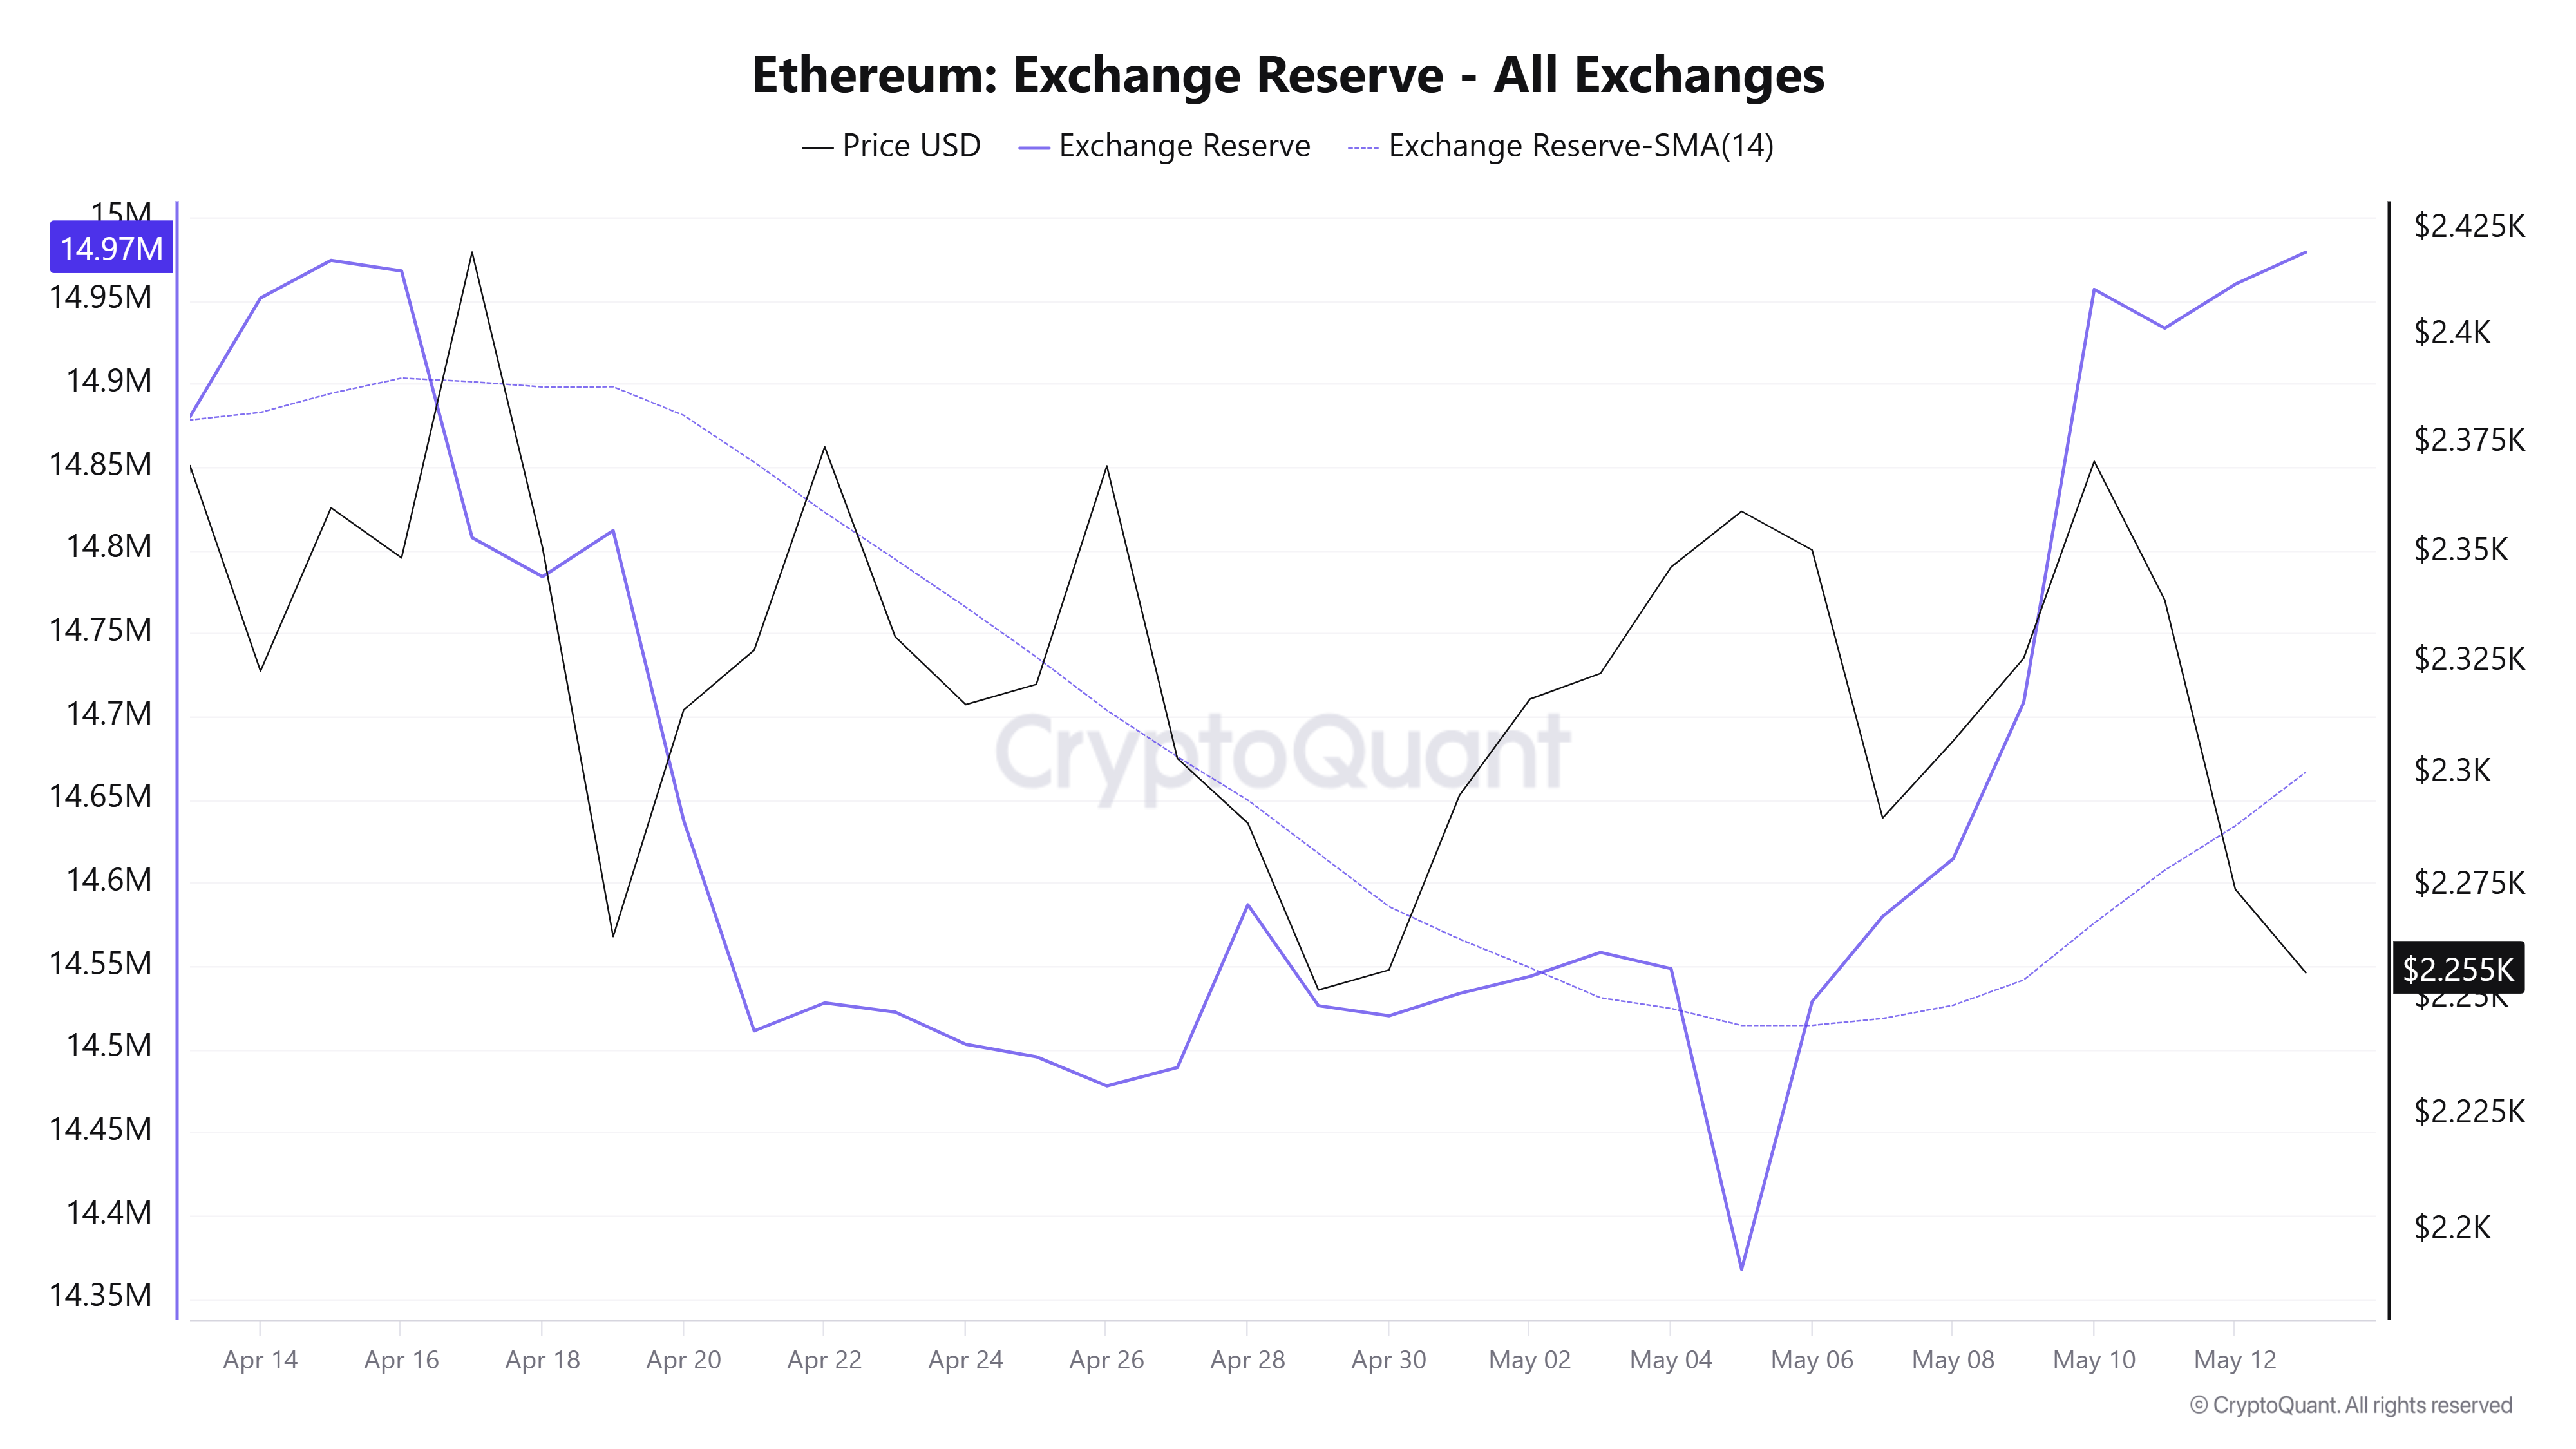
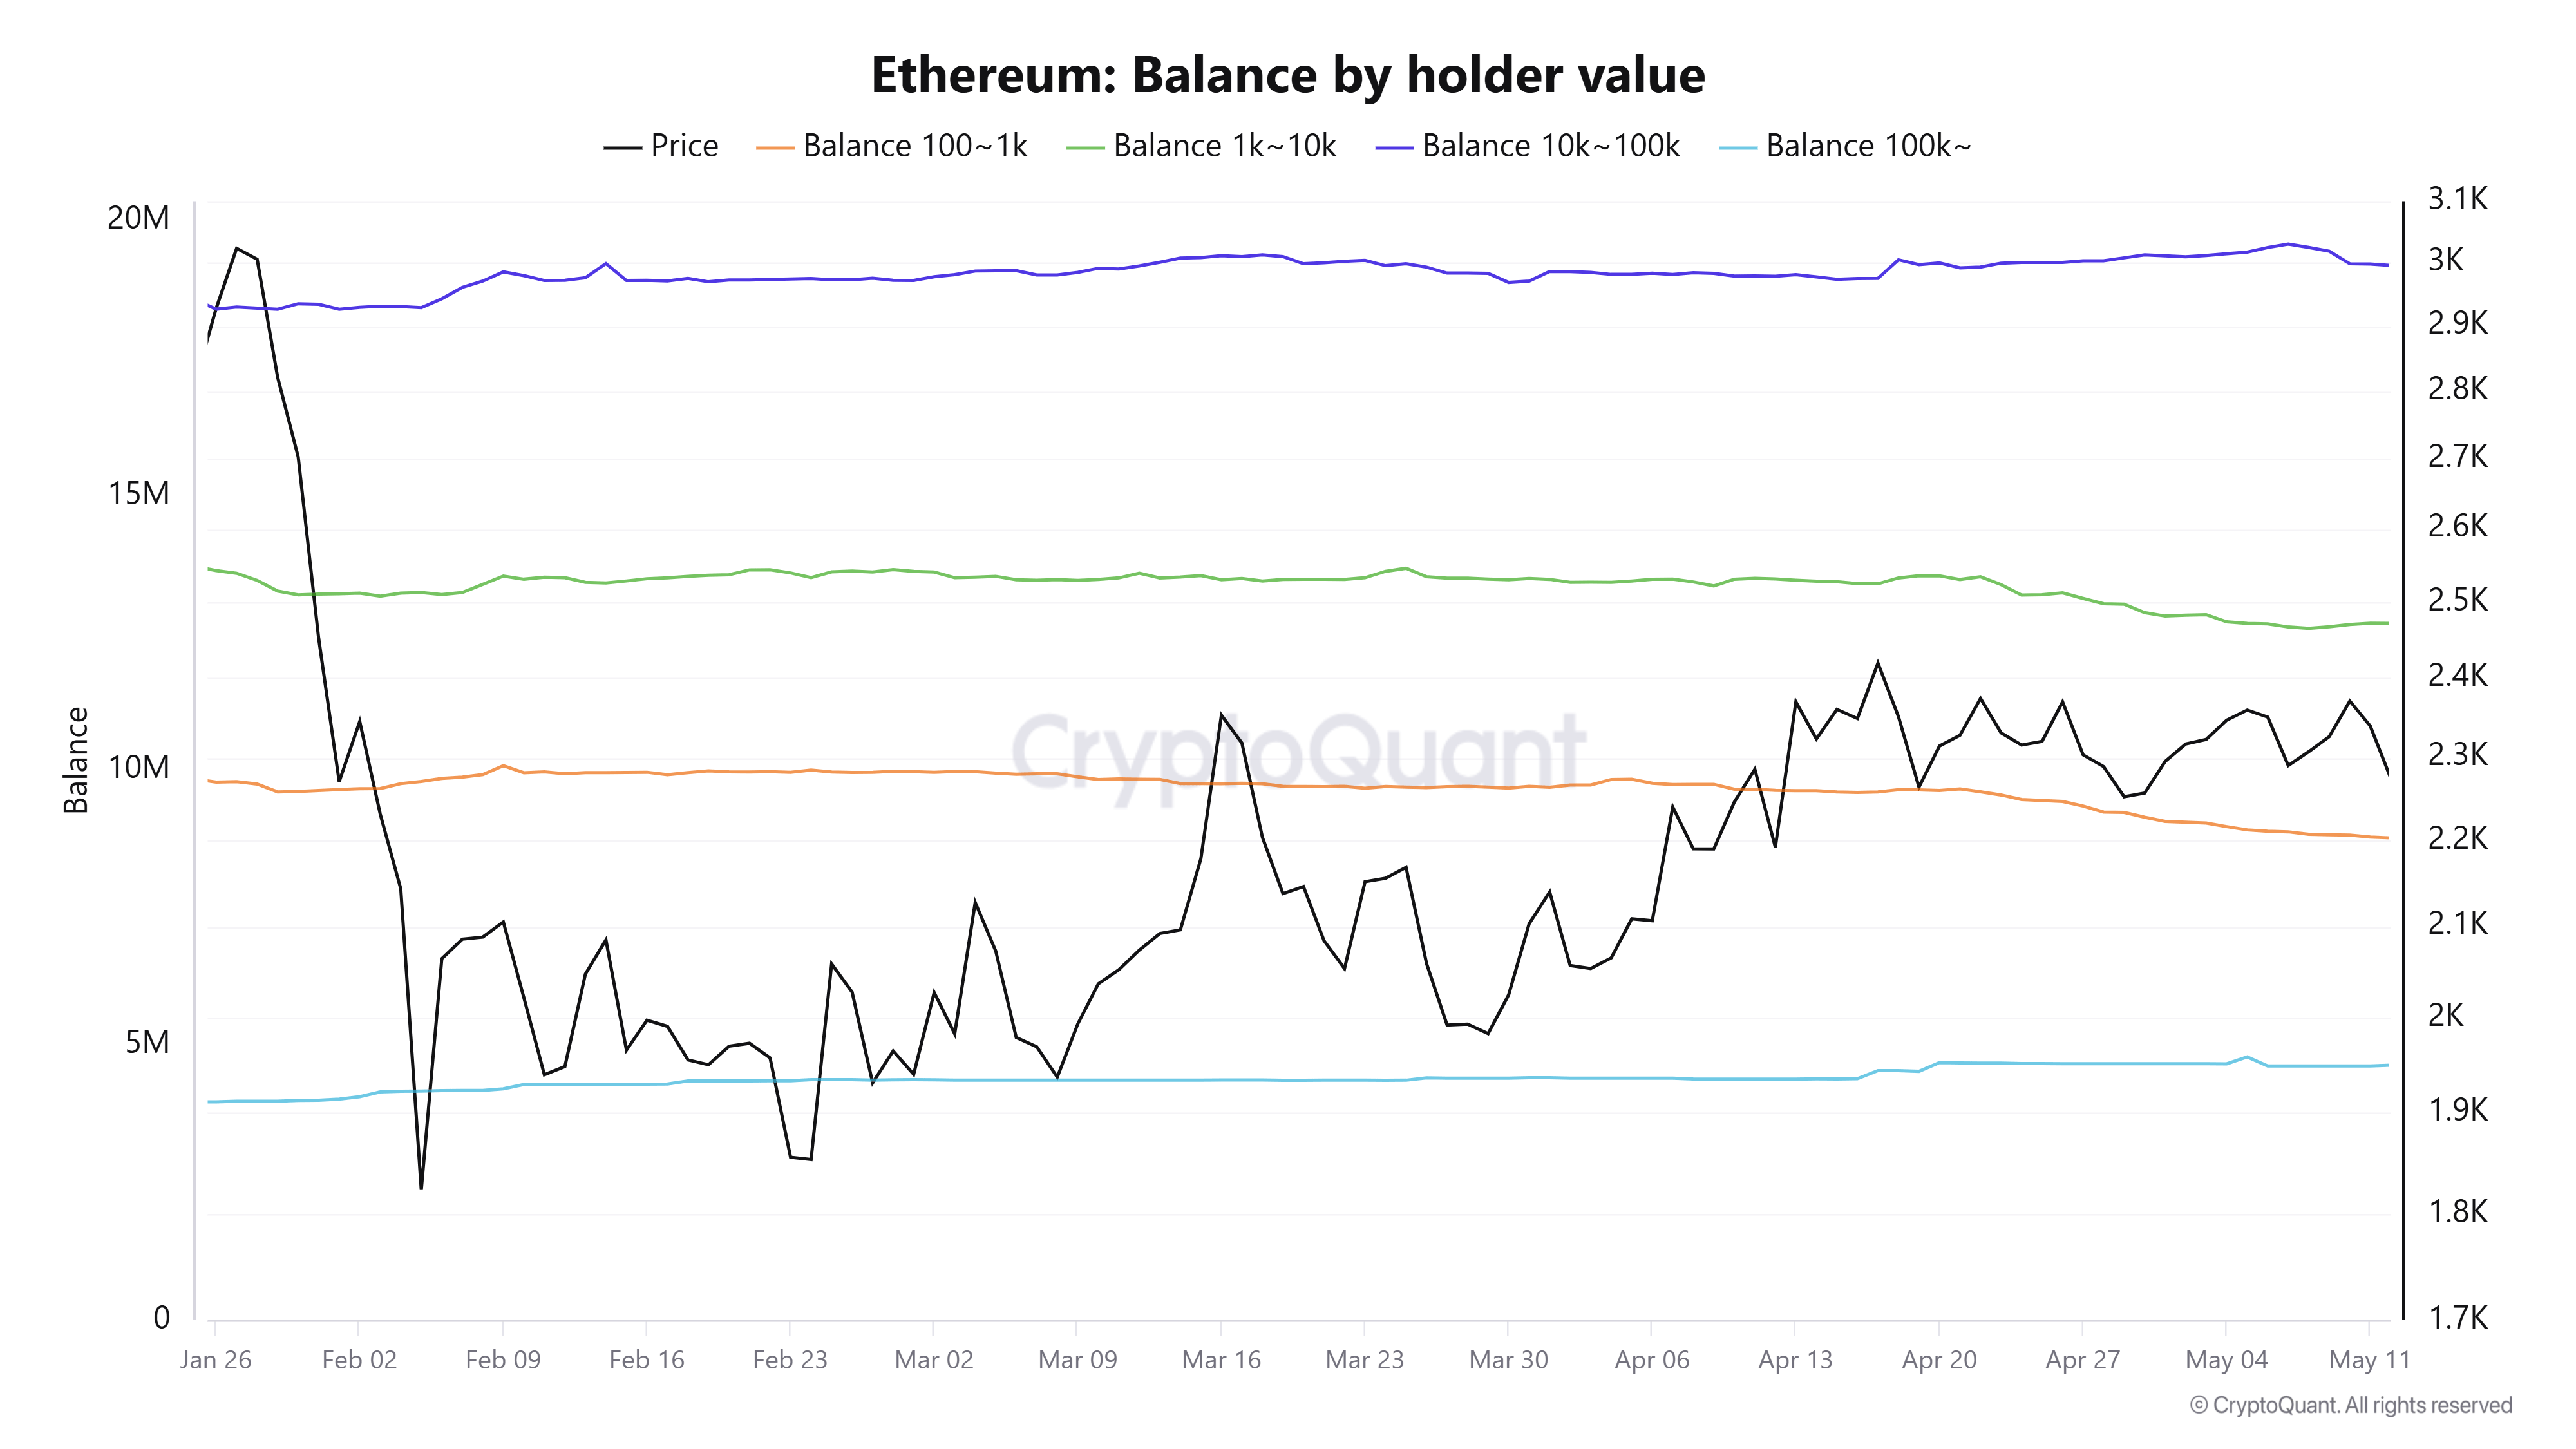
The distribution is likely spearheaded by whales holding 10K-100K ETH, who have scaled down their collective balance by 390K since May 7. This represents the cohort's largest weekly distribution since late March.
Retailers or investors holding 100-1K ETH also continued their selling activity, which has been consistent for a majority of the year so far, offloading 110K ETH over the past week. However, wallets with a balance of 1K-10K ETH paused distribution, with their holdings rising by 67K ETH during the same period.
Regionally, weak sentiment is evident across US markets, as the Coinbase Premium Index has been hovering in negative territory. The index compares ETH's price on Coinbase versus Binance, serving as a measure of US sentiment.
Similarly, distribution in ETH exchange-traded funds (ETFs) has increased, with the products posting a second consecutive day of net outflows worth $130.6 million, per SoSoValue data.
On the derivatives side, the 30-day moving average of ETH's Net Taker Volume has flipped negative for the first time since early March, indicating short positions have been dominating ETH futures lately. The metric measures the difference in volumes of buyers and sellers using market orders to purchase ETH perpetual contracts.
However, in the near term, long traders are returning following the recent price decline. Ethereum futures open interest has risen to a record high of 15.5 million ETH. Open interest is the total worth of outstanding contracts in a derivatives market.
At the same time, ETH's funding rates have posted their longest positive streak since January, indicating long traders are pouncing on the dip.
The dip-buying activity is also evident across a series of updates from smart money tracker Lookonchain, which show that most traders are opening long ETH positions or buying ETH on the spot market over the past few hours.
Ethereum Price Forecast: ETH loses 50-day EMA, eyes $2,211 support
Ethereum has recorded $95.6 million in liquidations over the past 24 hours, led by $84.3 million in liquidated long positions.
On the daily chart, ETH is maintaining a capped bias as it holds below the short, medium, and long-term Exponential Moving Averages (EMAs). The 50-day EMA at $2,273 is the first ceiling, followed closely by the 20-day EMA near $2,307 and the 100-day EMA around $2,352, forming a dense overhead supply zone that limits recovery attempts.
A softening Relative Strength Index (RSI) around 45 and a deeply oversold Stochastic reading near 12 suggest fading momentum, though the broader structure still leans lower while price remains under this EMA cluster.
On the downside, initial support emerges at the horizontal level near $2,211, ahead of a more substantial floor around $2,107. Below those levels, additional demand layers appear at $1,909 and $1,741, with deeper supports clustered toward $1,524 and $1,404 if selling accelerates.
On the topside, bulls would need to reclaim first the 50- and 20-day EMAs to ease immediate pressure, with the 100-day EMA and the horizontal resistance near $2,388 acting as subsequent hurdles before any test of the higher resistance band at $2,746.
(The technical analysis of this story was written with the help of an AI tool.)

100만 명이 넘는 사용자가 FXStreet를 통해 실시간 시장 데이터, 차트 도구, 전문가 인사이트, 포렉스 뉴스를 이용합니다. 포괄적인 경제 캘린더와 교육 웨비나는 트레이더가 정보를 유지하고 신중한 결정을 내리도록 돕습니다. FXStreet는 바르셀로나 본사와 전 세계 지역에 걸쳐 약 60명의 팀으로 구성되어 있습니다.
더 읽기


