

Ethereum Price Forecast: Why ETH is outperforming Bitcoin, XRP, SOL, HYPE
Ethereum price today: $1,870
- Ethereum has outperformed crypto majors Bitcoin, XRP, SOL and HYPE following a market boost from cooling inflation reports.
- The Robinhood Chain launch, ETH ETF inflows, BitMine's accumulation and Clarity Act discussions are spurring the outperformance.
- ETH saw a rejection at the 100-day EMA after rising 10% over the past week.
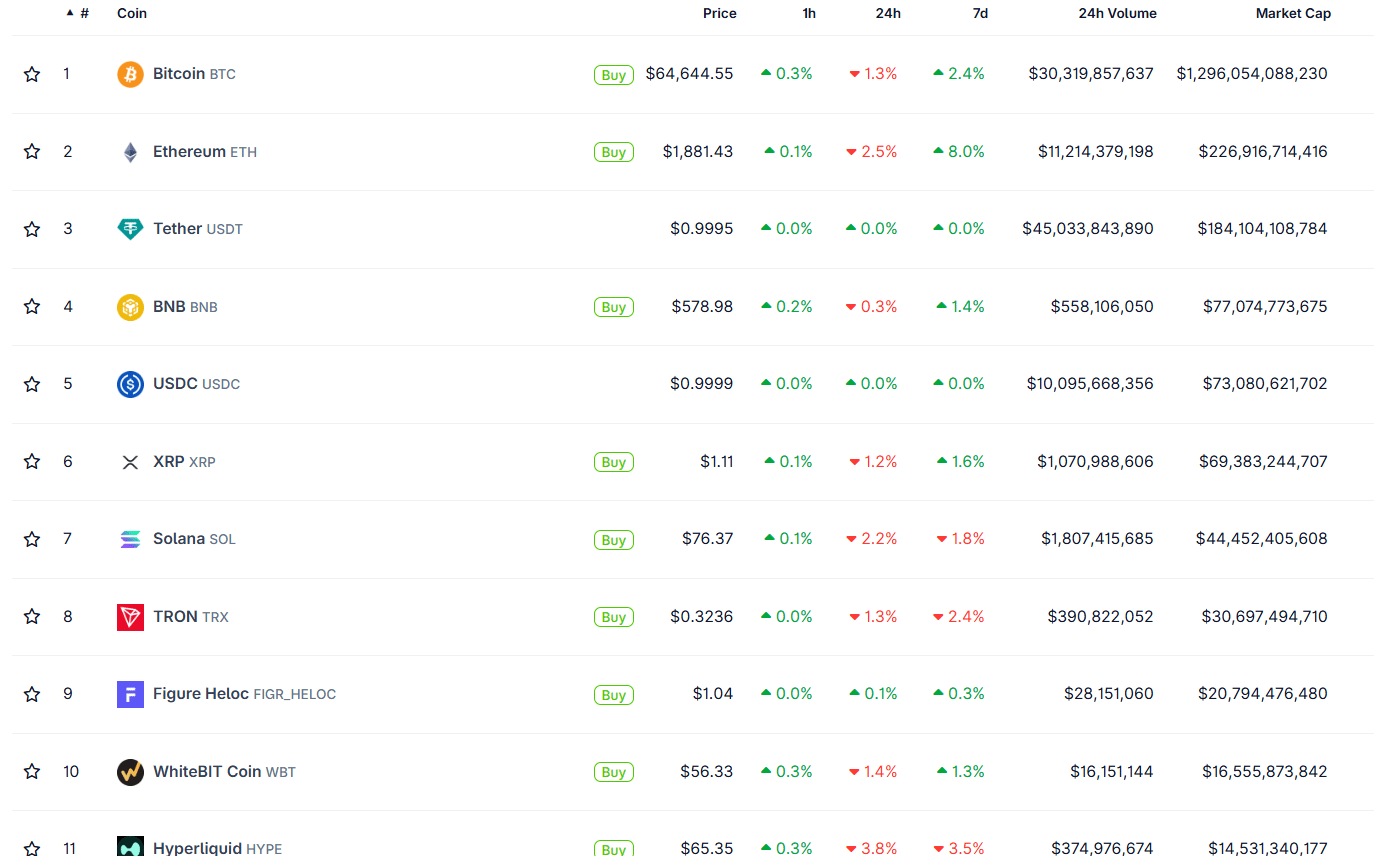
Ethereum (ETH) has outperformed the top 10 cryptocurrencies since the crypto market began a recovery last week. On a weekly timeframe, the top altcoin is seeing an 8% gain, compared to 2.4%, 1.4%, 1.6%, -1.8% and -3.5% for Bitcoin (BTC), BNB, XRP, Solana (SOL) and Hyperliquid (HYPE).
While cooling inflation reports and declining energy prices were primarily responsible for the recent broad rally across the crypto market, ETH's outperformance stems from several other key factors.
Why Ethereum is outperforming other top cryptos
The Robinhood Chain, launched on July 1 as an Ethereum Layer 2 (L2), has been spurring demand for native ETH. The amount of ETH bridged from the L1 to the L2 chain has surpassed $164 million, a 10x increase in the past week, according to onchain analytics platform Token Terminal.
"If adoption continues, the chain could become a meaningful new source of demand for Ethereum," the platform stated in a Thursday X post.
The chain has seen strong demand over the past week, attracting token launchpads and memecoin activity. In 2024, Solana saw a similar upsurge in memecoin activity before going on a run that outperformed major cryptocurrencies.
Beyond that, Ethereum is also attracting institutional capital again, with $96 million in net inflows over the past three days. Last week, US spot ETH ETFs ended an eight-week outflow streak after recording $84.4 million in net inflows, per SoSoValue data. Since the beginning of the month, the products have only seen two outflow days, while XRP and Solana products are struggling to attract capital.
Similarly, US spot BTC ETFs have posted four outflow days so far in July and are on track to end the week on negative flows.
In addition, Ethereum treasury firm BitMine Immersion has remained a consistent source of demand for the top altcoin, accumulating roughly 70,000 ETH in the past two weeks.
Strategy, on the other hand, which has been a major demand driver for Bitcoin, flipped to distribution over the past two weeks after it sold $216 million worth of BTC. The firm also failed to log any buying activity last week.
Increased discussion and positive sentiment around the Clarity Act are also filtering into Ethereum, as it hosts the majority of onchain activity. The L1 is the largest chain by total value locked (TVL) and tokenized assets, with $40.9 billion and $14.8 billion, respectively, according to DefiLlama data.
Despite several positive developments surrounding ETH currently, the broader crypto market recovery remains fragile amid resumed geopolitical tensions in the Middle East. Bitfinex analysts also noted that ETH ETF inflows are not yet strong enough to drive prices.
"The $96 million total sits against a market capitalization above $220 billion, which makes it a rounding error even allowing for the illiquid spot market. A bid concentrated in one issuer remains too narrow to call a regime," the analyst wrote in a Thursday market commentary.
"Whether Ether ETFs continue to draw buyer interest remains to be seen; they have struggled to do so across nearly two years since launch."
Bitfinex added that sustained improvements in onchain activity are a "stronger catalyst" for an L1 like Ethereum.
Ethereum Price Forecast: ETH fails to reclaim 100-day EMA despite 10% jump
On the daily chart, ETH/USDT trades at $1,874, maintaining a constructive bullish bias as price remains above the 20- and 50-day Exponential Moving Averages (EMAs) at $1,780 and $1,810, respectively. The altcoin remains capped by the longer-term 100-day EMA at $1,948 after a 10% rise over the past week, suggesting room for further upside only if this barrier is reclaimed.
Momentum stays supportive, with the 14-day Relative Strength Index (RSI) around 60 and the Stochastic hovering in the low 70s, hinting at a cooldown after a strong rally.
On the topside, immediate resistance is located at the horizontal level of $1,909, followed by $2,018 and $2,107, where prior supply converges. Above these, additional resistance is seen at $2,211 and then $2,388.
On the downside, initial support emerges at $1,806, ahead of the nearby dynamic floors offered by the 50- and 20-day EMAs. Below these, more substantial demand is seen at $1,741, with deeper supports at $1,524, $1,404 and $1,155 in the event of a broader corrective slide.
(The technical analysis of this story was written with the help of an AI tool. Know more.)














