
EUR/JPY Price Forecast: Remains close to near 187.50, fresh record highs
작성자 Akhtar Faruqui
수정됨: 14 Apr 2026


인기 기사

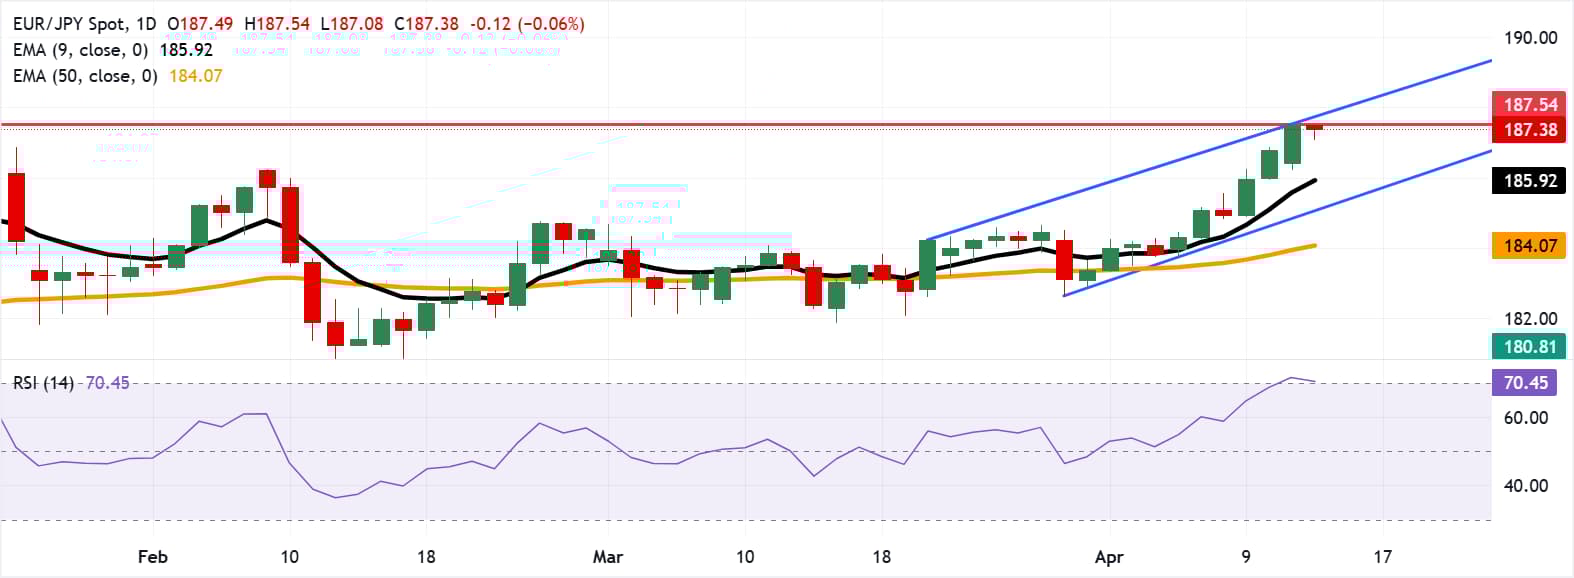
EUR/JPY halts its three-day winning streak, inching lower after reaching all-time highs and trading around 187.40 during the European hours on Tuesday.
- EUR/JPY cross may test the immediate barrier at the fresh record high of 187.54.
- The Relative Strength Index (14) at 70.10 indicates overbought conditions.
- The primary support lies at the nine-day EMA of 185.92.
EUR/JPY halts its three-day winning streak, inching lower after reaching all-time highs and trading around 187.40 during the European hours on Tuesday. The technical analysis of the daily chart indicates the currency cross is trending higher within an ascending channel, signaling a persistent bullish bias.
The EUR/JPY cross maintains a bullish near-term bias as it holds above both the nine-day and 50-day Exponential Moving Averages (EMAs). The alignment of the short-term above the long-term EMA suggests persistent upward pressure.
The Relative Strength Index (14) at 70.10 shows overbought conditions, hinting that upside momentum is strong but vulnerable to a corrective pause.
The EUR/JPY cross may target the immediate resistance at the all-time high of 187.54, recorded on April 14, followed by the upper boundary of the ascending channel around 187.80.
On the downside, the primary support lies at the nine-day EMA of 185.92. A move below this level could weaken the short-term price momentum, exposing the lower ascending channel boundary around 185.00, followed by the 50-day EMA at 184.07.
(The technical analysis of this story was written with the help of an AI tool.)
Euro Price Today
The table below shows the percentage change of Euro (EUR) against listed major currencies today. Euro was the weakest against the New Zealand Dollar.
| USD | EUR | GBP | JPY | CAD | AUD | NZD | CHF | |
|---|---|---|---|---|---|---|---|---|
| USD | -0.15% | -0.17% | -0.21% | -0.15% | -0.04% | -0.35% | -0.28% | |
| EUR | 0.15% | -0.02% | -0.04% | 0.00% | 0.11% | -0.21% | -0.14% | |
| GBP | 0.17% | 0.02% | -0.02% | 0.06% | 0.12% | -0.18% | -0.13% | |
| JPY | 0.21% | 0.04% | 0.02% | 0.06% | 0.17% | -0.14% | -0.09% | |
| CAD | 0.15% | -0.00% | -0.06% | -0.06% | 0.11% | -0.18% | -0.14% | |
| AUD | 0.04% | -0.11% | -0.12% | -0.17% | -0.11% | -0.30% | -0.26% | |
| NZD | 0.35% | 0.21% | 0.18% | 0.14% | 0.18% | 0.30% | 0.05% | |
| CHF | 0.28% | 0.14% | 0.13% | 0.09% | 0.14% | 0.26% | -0.05% |
The heat map shows percentage changes of major currencies against each other. The base currency is picked from the left column, while the quote currency is picked from the top row. For example, if you pick the Euro from the left column and move along the horizontal line to the US Dollar, the percentage change displayed in the box will represent EUR (base)/USD (quote).

100만 명이 넘는 사용자가 FXStreet를 통해 실시간 시장 데이터, 차트 도구, 전문가 인사이트, 포렉스 뉴스를 이용합니다. 포괄적인 경제 캘린더와 교육 웨비나는 트레이더가 정보를 유지하고 신중한 결정을 내리도록 돕습니다. FXStreet는 바르셀로나 본사와 전 세계 지역에 걸쳐 약 60명의 팀으로 구성되어 있습니다.
더 읽기


