
EUR/JPY Price Forecast: Tests 50-day EMA barrier near 183.00
작성자 Akhtar Faruqui
수정됨: 23 Feb 2026


인기 기사

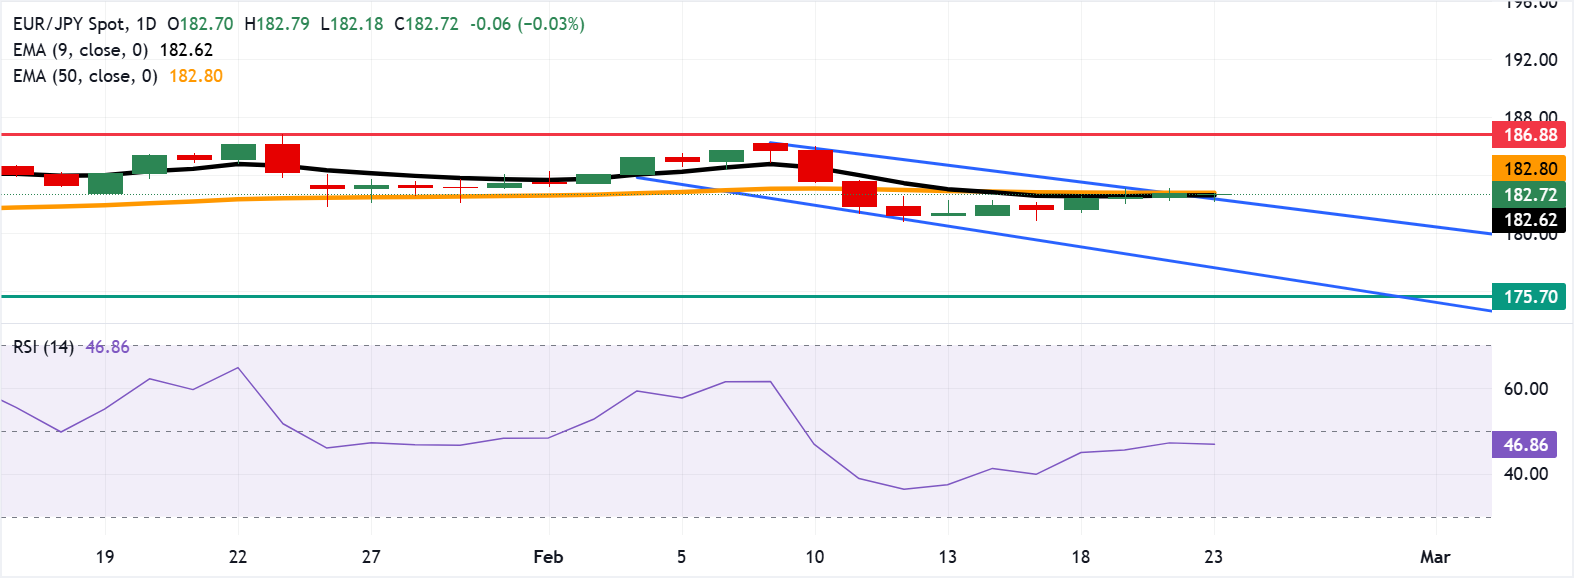
EUR/JPY remains steady after three days of gains, trading around 182.70 during the European hours on Monday. The technical analysis of the daily chart suggests a potential bullish reversal as the currency cross is positioned slightly above the upper boundary of the descending channel pattern.
- EUR/JPY tests the 50-day Exponential Moving Average at 182.80.
- The 14-day Relative Strength Index at 47 is capping upside momentum.
- A break below the nine-day EMA at 182.62 may push the cross back into the descending channel.
EUR/JPY remains steady after three days of gains, trading around 182.70 during the European hours on Monday. The technical analysis of the daily chart suggests a potential bullish reversal as the currency cross is positioned slightly above the upper boundary of the descending channel pattern. However, the 14-day Relative Strength Index (RSI) at 47 (neutral) stays below 50, tempering upside momentum.
EUR/JPY cross hovers just under the 50-day Exponential Moving Average (EMA) at 182.80 while holding marginally above the nine-day EMA at 182.62. The short-term average steadies after a pullback, whereas the broader 50-day slope softens, underscoring a range-bound bias.
Momentum would improve on a close back above the 50-day EMA, would cause the emergence of the bullish bias, and support the EUR/JPY cross to explore the region around the all-time high of 186.88, which was recorded on January 23.
On the downside, failure to hold the nine-day EMA could drag the EUR/JPY cross back into the descending channel and target the lower boundary of the channel around 177.80. Further declines below the channel would reinforce the bearish bias and put downward pressure on the currency cross to navigate the region around the four-month low of 175.70.
(The technical analysis of this story was written with the help of an AI tool.)
Euro Price Today
The table below shows the percentage change of Euro (EUR) against listed major currencies today. Euro was the strongest against the Australian Dollar.
| USD | EUR | GBP | JPY | CAD | AUD | NZD | CHF | |
|---|---|---|---|---|---|---|---|---|
| USD | -0.21% | -0.19% | -0.23% | -0.11% | 0.03% | -0.05% | -0.24% | |
| EUR | 0.21% | 0.03% | -0.02% | 0.12% | 0.24% | 0.17% | -0.03% | |
| GBP | 0.19% | -0.03% | -0.04% | 0.07% | 0.21% | 0.14% | -0.05% | |
| JPY | 0.23% | 0.02% | 0.04% | 0.14% | 0.28% | 0.20% | 0.02% | |
| CAD | 0.11% | -0.12% | -0.07% | -0.14% | 0.14% | 0.06% | -0.13% | |
| AUD | -0.03% | -0.24% | -0.21% | -0.28% | -0.14% | -0.07% | -0.27% | |
| NZD | 0.05% | -0.17% | -0.14% | -0.20% | -0.06% | 0.07% | -0.19% | |
| CHF | 0.24% | 0.03% | 0.05% | -0.02% | 0.13% | 0.27% | 0.19% |
The heat map shows percentage changes of major currencies against each other. The base currency is picked from the left column, while the quote currency is picked from the top row. For example, if you pick the Euro from the left column and move along the horizontal line to the US Dollar, the percentage change displayed in the box will represent EUR (base)/USD (quote).

100만 명이 넘는 사용자가 FXStreet를 통해 실시간 시장 데이터, 차트 도구, 전문가 인사이트, 포렉스 뉴스를 이용합니다. 포괄적인 경제 캘린더와 교육 웨비나는 트레이더가 정보를 유지하고 신중한 결정을 내리도록 돕습니다. FXStreet는 바르셀로나 본사와 전 세계 지역에 걸쳐 약 60명의 팀으로 구성되어 있습니다.
더 읽기


