
EUR/JPY Price Forecast: Tests confluence resistance near 182.50, nine-day EMA
작성자 Akhtar Faruqui
게시일: 20 Feb 2026 | 수정일: 20 Feb 2026


인기 기사

EUR/JPY inches lower after two days of gains, trading around 182.40 during the Asian hours on Friday. The technical analysis of the daily chart suggests a potential bullish reversal as the currency cross is testing the upper boundary of the descending channel pattern.
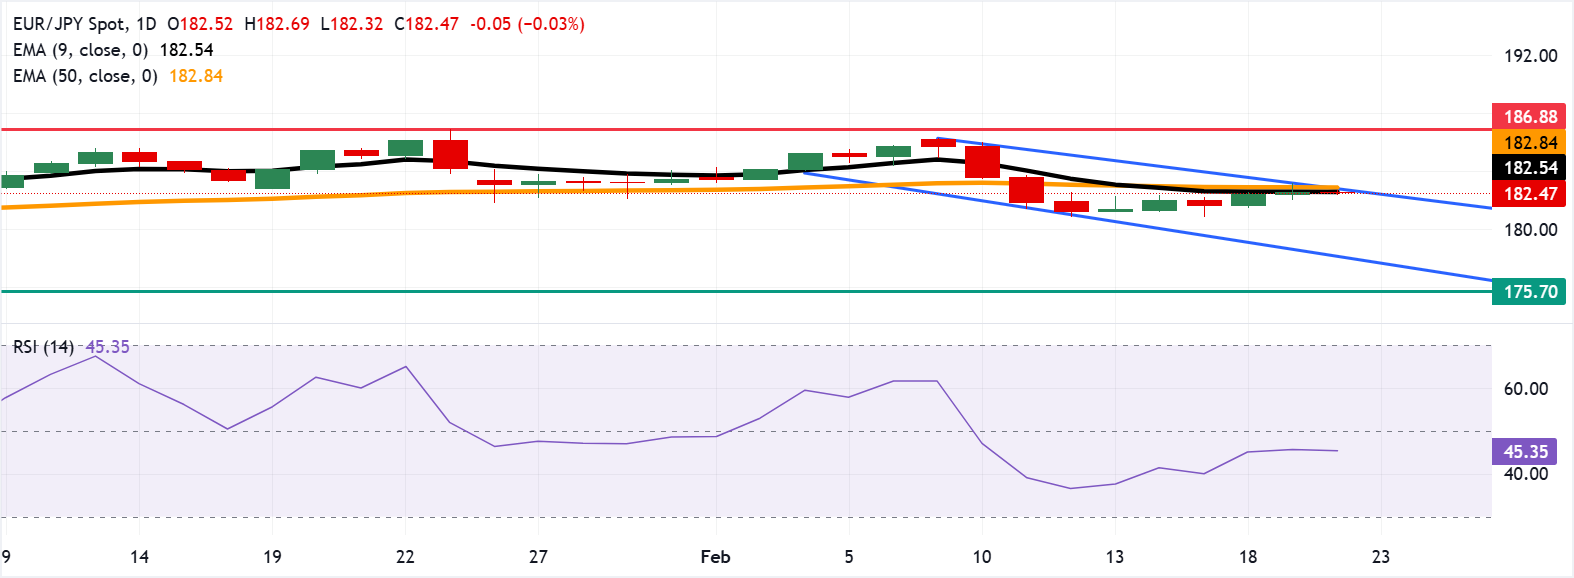
- EUR/JPY tests confluence resistance near the nine-day EMA at 182.54.
- The 14-day Relative Strength Index at 45 signals soft momentum.
- Further losses may target the descending channel’s lower boundary near 178.20.
EUR/JPY inches lower after two days of gains, trading around 182.40 during the Asian hours on Friday. The technical analysis of the daily chart suggests a potential bullish reversal as the currency cross is testing the upper boundary of the descending channel pattern. However, the 14-day Relative Strength Index (RSI) at 45 (neutral) sits below the 50 mid-line, aligning with soft momentum.
The EUR/JPY cross holds beneath the nine-day Exponential Moving Average (EMA) and the 50-day EMA, keeping the short-term tone heavy as the medium-term gauge flattens. The 50-day EMA has started to roll over, signaling fading trend strength.
The EUR/JPY cross is testing the confluence resistance zone at the nine-day EMA at 182.54, followed by the 50-day EMA at 182.84, aligned with the upper descending channel boundary. A break above this resistance zone would cause the emergence of the bullish bias and support the pair to explore the region around the all-time high of 186.88, which was recorded on January 23.
Failure to reclaim the nine-day EMA would cap rebounds and keep pressure on nearby static floors. A downside extension could target the lower boundary of the descending channel around 178.20. Further declines below the channel would strengthen the bearish bias and put downward pressure on the currency cross to navigate the region around the four-month low of 175.70.
(The technical analysis of this story was written with the help of an AI tool.)
Euro Price Today
The table below shows the percentage change of Euro (EUR) against listed major currencies today. Euro was the weakest against the US Dollar.
| USD | EUR | GBP | JPY | CAD | AUD | NZD | CHF | |
|---|---|---|---|---|---|---|---|---|
| USD | 0.10% | 0.10% | 0.08% | 0.01% | 0.42% | 0.46% | 0.07% | |
| EUR | -0.10% | 0.00% | -0.04% | -0.09% | 0.32% | 0.36% | -0.03% | |
| GBP | -0.10% | -0.00% | -0.02% | -0.09% | 0.31% | 0.34% | -0.03% | |
| JPY | -0.08% | 0.04% | 0.02% | -0.06% | 0.34% | 0.37% | -0.01% | |
| CAD | -0.01% | 0.09% | 0.09% | 0.06% | 0.40% | 0.43% | 0.06% | |
| AUD | -0.42% | -0.32% | -0.31% | -0.34% | -0.40% | 0.04% | -0.35% | |
| NZD | -0.46% | -0.36% | -0.34% | -0.37% | -0.43% | -0.04% | -0.39% | |
| CHF | -0.07% | 0.03% | 0.03% | 0.00% | -0.06% | 0.35% | 0.39% |
The heat map shows percentage changes of major currencies against each other. The base currency is picked from the left column, while the quote currency is picked from the top row. For example, if you pick the Euro from the left column and move along the horizontal line to the US Dollar, the percentage change displayed in the box will represent EUR (base)/USD (quote).

100만 명이 넘는 사용자가 FXStreet를 통해 실시간 시장 데이터, 차트 도구, 전문가 인사이트, 포렉스 뉴스를 이용합니다. 포괄적인 경제 캘린더와 교육 웨비나는 트레이더가 정보를 유지하고 신중한 결정을 내리도록 돕습니다. FXStreet는 바르셀로나 본사와 전 세계 지역에 걸쳐 약 60명의 팀으로 구성되어 있습니다.
더 읽기


