
EUR/JPY Price Forecast: Trades near 185.00 after rebounding from triangle bottom
작성자 Akhtar Faruqui
수정됨: 8 Jun 2026


인기 기사

EUR/JPY gains ground after registering over 0.5% in the previous day, trading around 184.90 during the Asian hours on Monday.
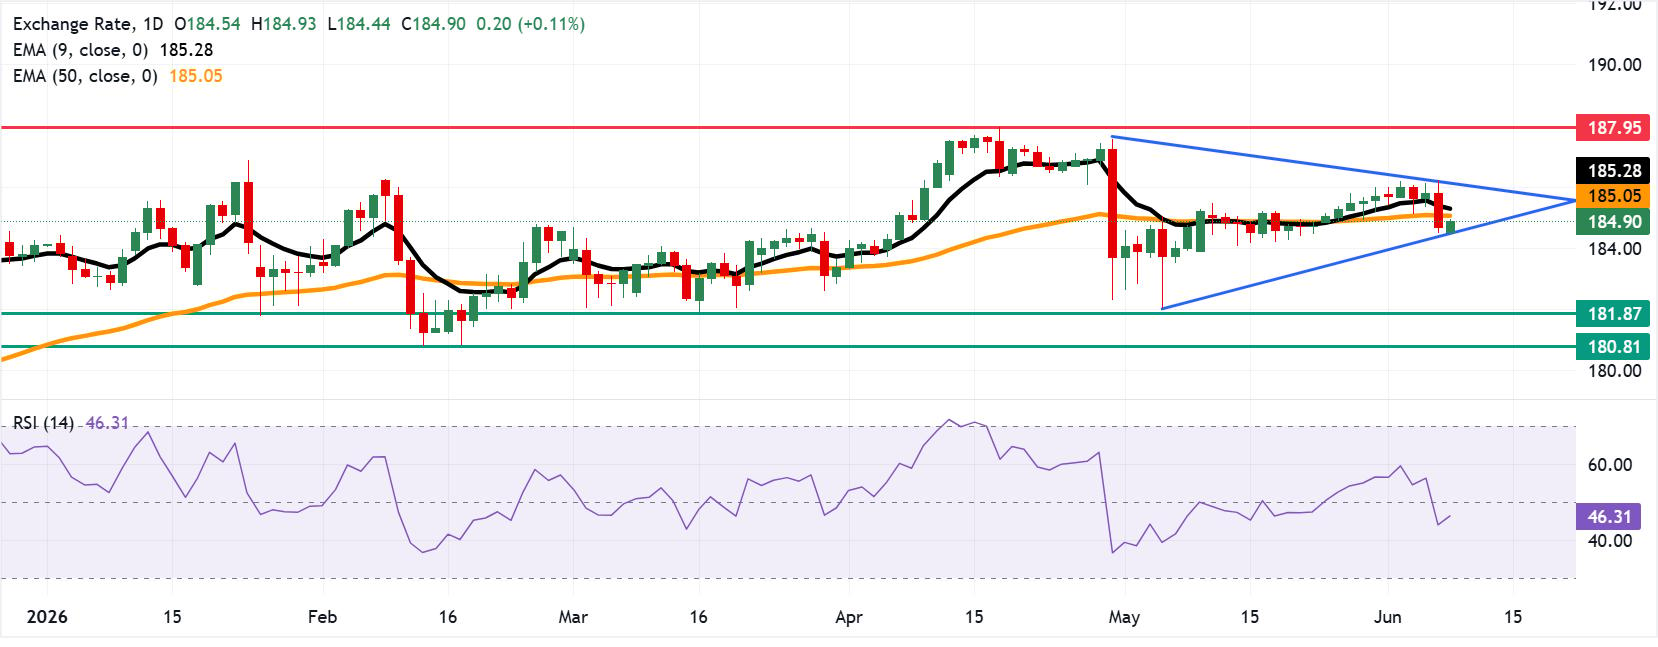
- EUR/JPY may retest the symmetrical triangle's lower support boundary near 184.40.
- The 14-day Relative Strength Index at 45.66 remains below the midline, signaling that bullish momentum is fading.
- The initial barrier lies at the 50-day EMA of 185.05.
EUR/JPY gains ground after registering over 0.5% in the previous day, trading around 184.90 during the Asian hours on Monday. The EUR/JPY cross is holding beneath both the 50-day and nine-day Exponential Moving Averages (EMAs), which keeps the near-term bias tilted to the downside despite the broader uptrend.
The 14-day Relative Strength Index (RSI) at 45.66 stays below the midline, hinting at fading bullish momentum and reinforcing the idea that recent bounces are likely to struggle while price remains capped under this short-term EMA cluster.
The technical analysis of the daily chart suggests the EUR/JPY cross is positioned near the lower boundary of the symmetrical triangle pattern around 184.40. The triangle suggests a period of consolidation, though a break below it would reinforce the bearish bias and put downward pressure on the currency cross to navigate the region around the three-month low of 181.87, recorded on March 16, followed by the nearly six-month low of 180.81, reached on February 12.
On the upside, the primary barrier lies at the 50-day EMA of 185.05, followed by the nine-day EMA at 185.28 and the upper boundary of the symmetrical triangle around 186.30. Further advances would expose the all-time high of 187.95, recorded on April 17.
(The technical analysis of this story was written with the help of an AI tool.)
Euro Price Today
The table below shows the percentage change of Euro (EUR) against listed major currencies today. Euro was the strongest against the Swiss Franc.
| USD | EUR | GBP | JPY | CAD | AUD | NZD | CHF | |
|---|---|---|---|---|---|---|---|---|
| USD | -0.04% | 0.04% | 0.05% | 0.07% | -0.04% | -0.10% | 0.20% | |
| EUR | 0.04% | 0.06% | 0.07% | 0.10% | -0.02% | -0.06% | 0.22% | |
| GBP | -0.04% | -0.06% | 0.00% | 0.03% | -0.12% | -0.14% | 0.14% | |
| JPY | -0.05% | -0.07% | 0.00% | 0.00% | -0.12% | -0.14% | 0.12% | |
| CAD | -0.07% | -0.10% | -0.03% | -0.00% | -0.12% | -0.16% | 0.11% | |
| AUD | 0.04% | 0.02% | 0.12% | 0.12% | 0.12% | -0.03% | 0.25% | |
| NZD | 0.10% | 0.06% | 0.14% | 0.14% | 0.16% | 0.03% | 0.26% | |
| CHF | -0.20% | -0.22% | -0.14% | -0.12% | -0.11% | -0.25% | -0.26% |
The heat map shows percentage changes of major currencies against each other. The base currency is picked from the left column, while the quote currency is picked from the top row. For example, if you pick the Euro from the left column and move along the horizontal line to the US Dollar, the percentage change displayed in the box will represent EUR (base)/USD (quote).

100만 명이 넘는 사용자가 FXStreet를 통해 실시간 시장 데이터, 차트 도구, 전문가 인사이트, 포렉스 뉴스를 이용합니다. 포괄적인 경제 캘린더와 교육 웨비나는 트레이더가 정보를 유지하고 신중한 결정을 내리도록 돕습니다. FXStreet는 바르셀로나 본사와 전 세계 지역에 걸쳐 약 60명의 팀으로 구성되어 있습니다.
더 읽기


