
EUR/USD Price Forecast: Holds losses below 1.1850 near nine-day EMA barrier
작성자 Akhtar Faruqui
게시일: 17 Feb 2026 | 수정일: 17 Feb 2026


인기 기사

EUR/USD extends its losses for the second successive session, trading around 1.1840 during the early European hours on Tuesday. The 14-day Relative Strength Index (RSI) momentum indicator at 53 (neutral) signals consolidation with a modest upside lean.
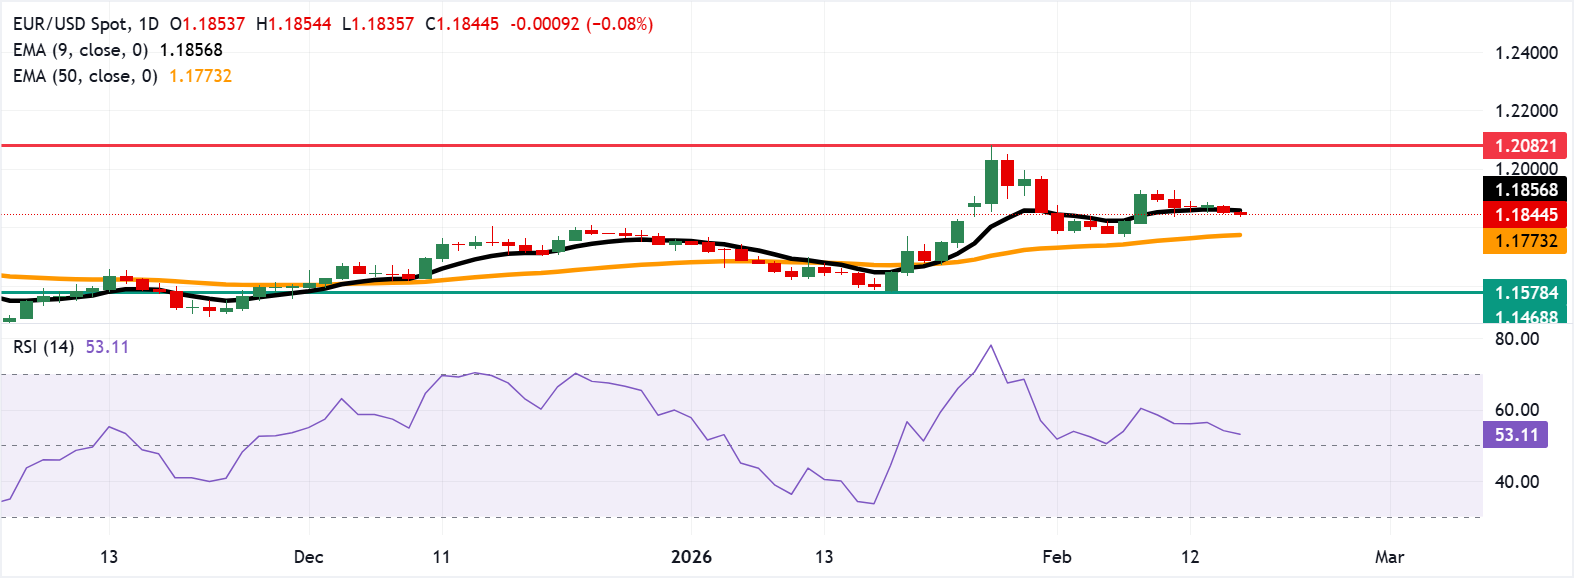
- EUR/USD tests immediate resistance at the nine-day EMA at 1.1856.
- The 14-day Relative Strength Index at 53 suggests consolidation with a slight bullish bias.
- A break below the nine-day EMA could expose the pair to a pullback toward the 50-day EMA at 1.1773.
EUR/USD extends its losses for the second successive session, trading around 1.1840 during the early European hours on Tuesday. The 14-day Relative Strength Index (RSI) momentum indicator at 53 (neutral) signals consolidation with a modest upside lean.
The technical analysis of the daily chart shows that the EUR/USD pair holds above the rising 50-day EMA, while the nine-day EMA flattens just overhead. The short-term average remains above the medium-term gauge, keeping the near-term bias supported.
The immediate resistance lies at the psychological level of 1.1850, aligned with the nine-day EMA at 1.1856. Traction above the short-term average would underpin momentum and keep focus on resistance aligning at 1.2082, the highest level since June 2021.
Should the pair fail to clear the cited ceiling at short-term average, price would stay rangebound and vulnerable to pullbacks toward the 50-day EMA at 1.1773 and shift focus to deeper supports toward the two-month low at 1.1578, recorded on January 19.
(The technical analysis of this story was written with the help of an AI tool.)
Euro Price Today
The table below shows the percentage change of Euro (EUR) against listed major currencies today. Euro was the weakest against the Japanese Yen.
| USD | EUR | GBP | JPY | CAD | AUD | NZD | CHF | |
|---|---|---|---|---|---|---|---|---|
| USD | 0.08% | 0.13% | -0.41% | 0.03% | 0.12% | -0.05% | -0.05% | |
| EUR | -0.08% | 0.05% | -0.51% | -0.04% | 0.05% | -0.13% | -0.13% | |
| GBP | -0.13% | -0.05% | -0.54% | -0.09% | -0.01% | -0.18% | -0.18% | |
| JPY | 0.41% | 0.51% | 0.54% | 0.46% | 0.55% | 0.36% | 0.37% | |
| CAD | -0.03% | 0.04% | 0.09% | -0.46% | 0.09% | -0.09% | -0.09% | |
| AUD | -0.12% | -0.05% | 0.00% | -0.55% | -0.09% | -0.18% | -0.17% | |
| NZD | 0.05% | 0.13% | 0.18% | -0.36% | 0.09% | 0.18% | 0.00% | |
| CHF | 0.05% | 0.13% | 0.18% | -0.37% | 0.09% | 0.17% | -0.00% |
The heat map shows percentage changes of major currencies against each other. The base currency is picked from the left column, while the quote currency is picked from the top row. For example, if you pick the Euro from the left column and move along the horizontal line to the US Dollar, the percentage change displayed in the box will represent EUR (base)/USD (quote).

100만 명이 넘는 사용자가 FXStreet를 통해 실시간 시장 데이터, 차트 도구, 전문가 인사이트, 포렉스 뉴스를 이용합니다. 포괄적인 경제 캘린더와 교육 웨비나는 트레이더가 정보를 유지하고 신중한 결정을 내리도록 돕습니다. FXStreet는 바르셀로나 본사와 전 세계 지역에 걸쳐 약 60명의 팀으로 구성되어 있습니다.
더 읽기


