
EUR/USD Price Forecast: Remains near 1.1750 barrier, upper descending channel boundary
작성자 Akhtar Faruqui
게시일: 23 Jan 2026 | 수정일: 23 Jan 2026


인기 기사

EUR/USD edges lower after registering over 0.5% gains in the previous session, trading around 1.1740 during the Asian hours on Friday.
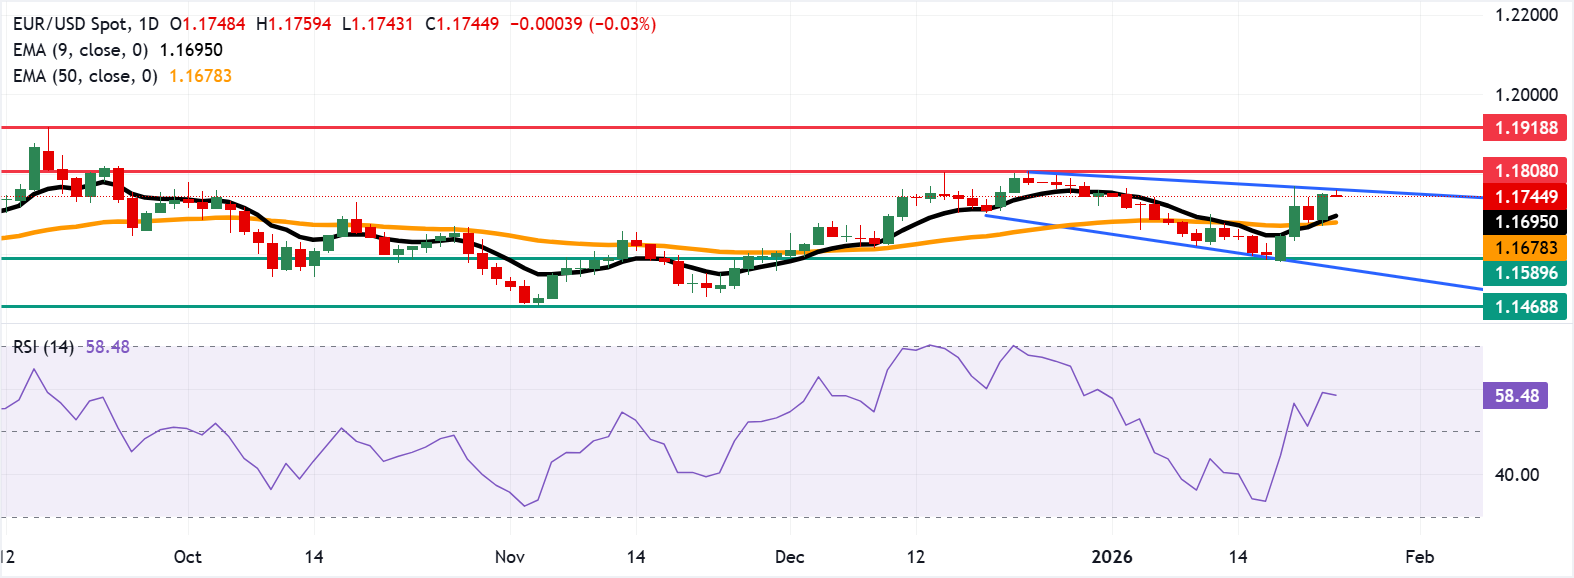
- EUR/USD tests the upper boundary of the descending channel around 1.1760.
- The 14-day Relative Strength Index holding above the midpoint signals neutral-to-bullish momentum.
- Both moving averages are trending upward, with the nine-EMA above the 50-day EMA, confirming a bullish setup.
EUR/USD edges lower after registering over 0.5% gains in the previous session, trading around 1.1740 during the Asian hours on Friday. The technical analysis of the daily chart shows that the pair remains close to the upper boundary of the descending channel pattern, suggesting a potential bullish reversal.
The EUR/USD pair is above the nine-day Exponential Moving Average (EMA) and the 50-day EMA, keeping a positive short-term bias. Both averages slope higher, with the nine-EMA above the 50-day EMA, reinforcing a bullish structure. Trend studies remain supportive as the 50-day EMA rises and price trades comfortably above it. The nine-day EMA continues to track higher and caps shallow pullbacks.
The 14-day Relative Strength Index (RSI) momentum indicator at 58 (neutral) remains above the midline as momentum has eased modestly. RSI above 50 confirms balanced-to-bullish momentum.
A sustained topside break above the upper boundary of the descending channel around 1.1760 could extend the advance toward the three-month high of 1.1808, which was recorded on December 24, while continued strength would keep buyers attentive to higher resistance at 1.1918, the highest level since June 2021.
A slip back through the confluence around the nine-day EMA at 1.1695 and 50-day EMA at 1.1678 would tilt risk toward the seven-week low at 1.1589, set on December 1, followed by the lower boundary of the descending channel around 1.1570.
(The technical analysis of this story was written with the help of an AI tool.)
Euro Price Today
The table below shows the percentage change of Euro (EUR) against listed major currencies today. Euro was the strongest against the Japanese Yen.
| USD | EUR | GBP | JPY | CAD | AUD | NZD | CHF | |
|---|---|---|---|---|---|---|---|---|
| USD | 0.03% | 0.04% | 0.13% | 0.06% | -0.03% | 0.01% | 0.08% | |
| EUR | -0.03% | 0.00% | 0.09% | 0.02% | -0.06% | -0.02% | 0.07% | |
| GBP | -0.04% | -0.01% | 0.09% | 0.02% | -0.07% | -0.03% | 0.06% | |
| JPY | -0.13% | -0.09% | -0.09% | -0.06% | -0.15% | -0.12% | -0.02% | |
| CAD | -0.06% | -0.02% | -0.02% | 0.06% | -0.09% | -0.06% | 0.04% | |
| AUD | 0.03% | 0.06% | 0.07% | 0.15% | 0.09% | 0.04% | 0.14% | |
| NZD | -0.01% | 0.02% | 0.03% | 0.12% | 0.06% | -0.04% | 0.09% | |
| CHF | -0.08% | -0.07% | -0.06% | 0.02% | -0.04% | -0.14% | -0.09% |
The heat map shows percentage changes of major currencies against each other. The base currency is picked from the left column, while the quote currency is picked from the top row. For example, if you pick the Euro from the left column and move along the horizontal line to the US Dollar, the percentage change displayed in the box will represent EUR (base)/USD (quote).

100만 명이 넘는 사용자가 FXStreet를 통해 실시간 시장 데이터, 차트 도구, 전문가 인사이트, 포렉스 뉴스를 이용합니다. 포괄적인 경제 캘린더와 교육 웨비나는 트레이더가 정보를 유지하고 신중한 결정을 내리도록 돕습니다. FXStreet는 바르셀로나 본사와 전 세계 지역에 걸쳐 약 60명의 팀으로 구성되어 있습니다.
더 읽기


