
EUR/USD Price Forecast: Rises towards 1.1600 but RSI remains bearish
작성자 Christian Borjon Valencia
수정됨: 11 Jun 2026


인기 기사

The EUR/USD surges over 0.36% as the Greenback turns negative on the day, as US President Donald Trump cancelled strikes on Iran, saying that the US and Iran are ironing out the final points of a peace agreement. At the time of writing, the pair trades at 1.1579.
- EUR/USD consolidates below 1.1600 as RSI shows improving momentum.
- Break above 1.1600 exposes key SMA confluence resistance zone.
- Failure below 1.1600 risks retest of 1.1500 support.
The EUR/USD surges over 0.36% as the Greenback turns negative on the day, as US President Donald Trump cancelled strikes on Iran, saying that the US and Iran are ironing out the final points of a peace agreement. At the time of writing, the pair trades at 1.1579.
EUR/USD Price Forecast: Technical outlook
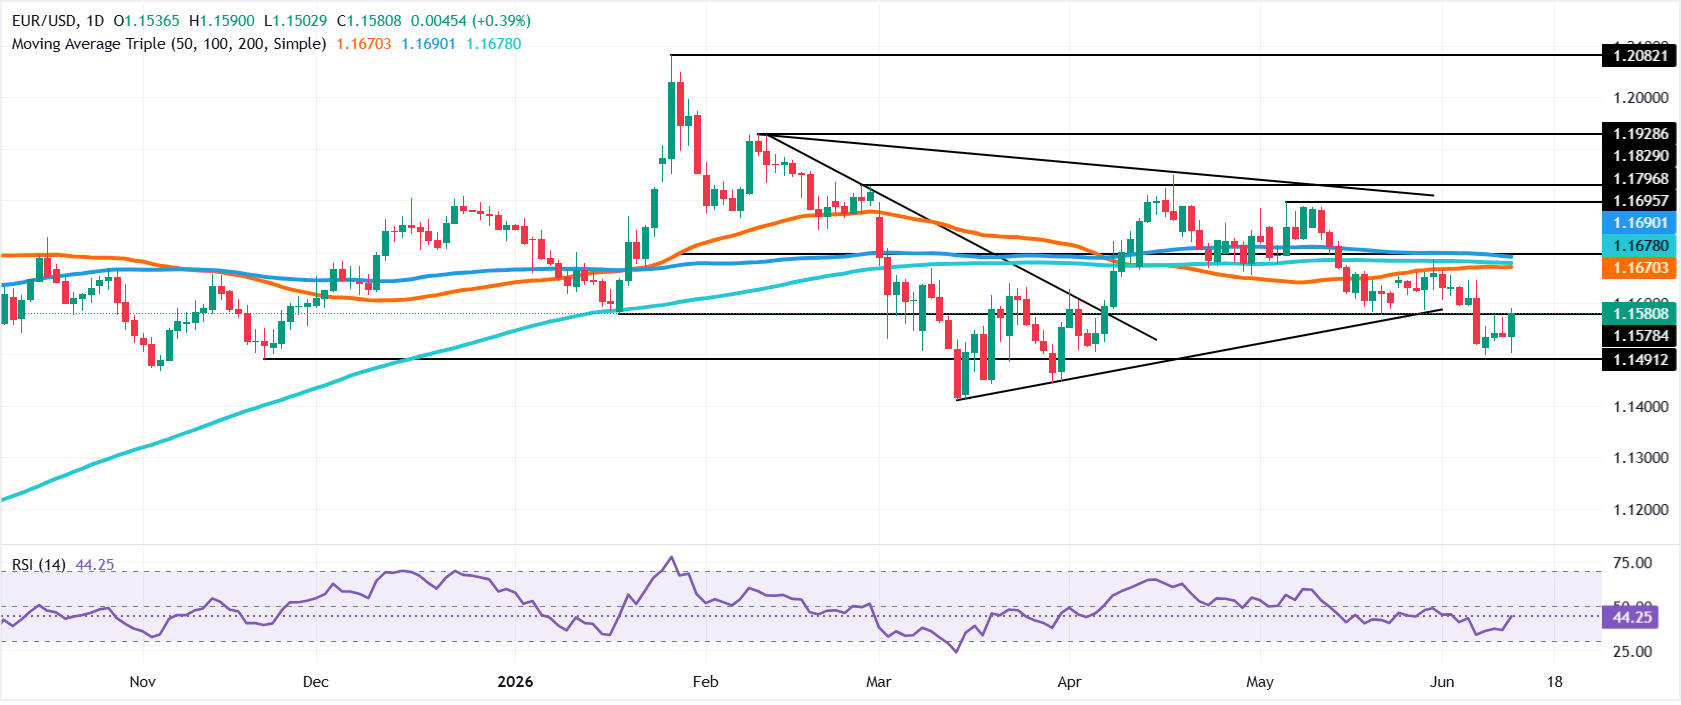
Even though the EUR/USD bounced off the lows of the week at around 1.1589, it seems to be consolidating below 1.1600.
Momentum, as measured by the Relative Strength Index (RSI), shows that buyers are gaining strength, though the index is below the 50-neutral level, suggesting caution is warranted.
For a bullish resumption, the EUR/USD must clear 1.1600. Once hurdled, the next resistance is the confluence of the 50- and 200-day SMAs at around the 1.1655-1.1676 area, followed by the 100-day SMA at 1.1689 ahead of 1.1700.
Conversely, if sellers keep EUR/USD below 1.1600, it opens the door to a retest of 1.1500. Below this level, the next stop would be the March 30 daily low of 1.1443. Below this level, the next area of interest would be 1.1400.
EUR/USD Price Chart – Daily
Euro Price Today
The table below shows the percentage change of Euro (EUR) against listed major currencies today. Euro was the strongest against the Canadian Dollar.
| USD | EUR | GBP | JPY | CAD | AUD | NZD | CHF | |
|---|---|---|---|---|---|---|---|---|
| USD | -0.40% | -0.39% | -0.46% | 0.11% | -0.67% | -0.80% | -0.69% | |
| EUR | 0.40% | 0.00% | -0.07% | 0.50% | -0.38% | -0.36% | -0.29% | |
| GBP | 0.39% | -0.01% | -0.09% | 0.50% | -0.37% | -0.37% | -0.30% | |
| JPY | 0.46% | 0.07% | 0.09% | 0.57% | -0.32% | -0.33% | -0.21% | |
| CAD | -0.11% | -0.50% | -0.50% | -0.57% | -0.87% | -0.87% | -0.79% | |
| AUD | 0.67% | 0.38% | 0.37% | 0.32% | 0.87% | -0.01% | 0.07% | |
| NZD | 0.80% | 0.36% | 0.37% | 0.33% | 0.87% | 0.01% | 0.10% | |
| CHF | 0.69% | 0.29% | 0.30% | 0.21% | 0.79% | -0.07% | -0.10% |
The heat map shows percentage changes of major currencies against each other. The base currency is picked from the left column, while the quote currency is picked from the top row. For example, if you pick the Euro from the left column and move along the horizontal line to the US Dollar, the percentage change displayed in the box will represent EUR (base)/USD (quote).

100만 명이 넘는 사용자가 FXStreet를 통해 실시간 시장 데이터, 차트 도구, 전문가 인사이트, 포렉스 뉴스를 이용합니다. 포괄적인 경제 캘린더와 교육 웨비나는 트레이더가 정보를 유지하고 신중한 결정을 내리도록 돕습니다. FXStreet는 바르셀로나 본사와 전 세계 지역에 걸쳐 약 60명의 팀으로 구성되어 있습니다.
더 읽기


