

GBP/JPY Price Forecast: Bulls remain in control with RSI and MACD in positive territory
- GBP/JPY heads for a third weekly gain amid broad-based Yen weakness and Pound strength.
- Japan's Finance Minister calls for greater domestic pension fund investment in Japanese financial assets.
- GBP/JPY maintains a bullish technical outlook while holding above key moving averages.
GBP/JPY trades under pressure on Friday after comments from Japan's Finance Minister Satsuki Katayama boosted the Japanese Yen (JPY). At the time of writing, the cross is trading around 217.10, down 0.30% on the day.
Katayama said the government would encourage domestic pension funds, including the Government Pension Investment Fund (GPIF), to increase their holdings of Japanese financial assets.

However, the remarks did little to reverse the Yen's broad-based weakness, leaving GBP/JPY pinned near levels last seen in 2008 and on track for a third consecutive weekly gain.
Meanwhile, the British Pound (GBP) remains the strongest-performing G10 currency in recent weeks, supported by Bank of England (BoE) interest rate hike bets and easing political uncertainty in the United Kingdom.
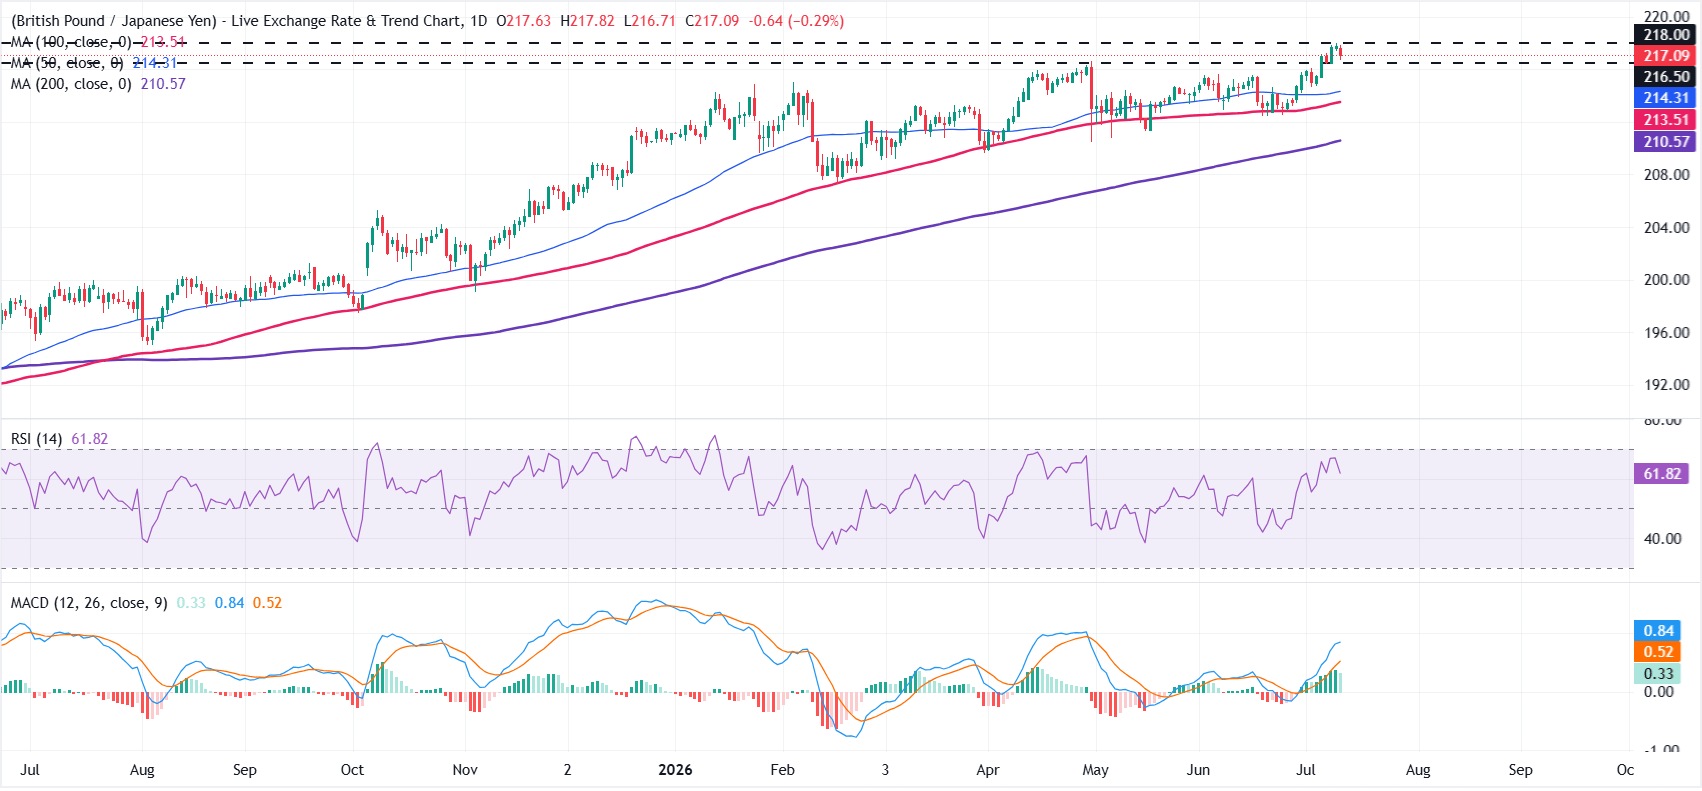
From a technical perspective, GBP/JPY maintains a bullish bias on the daily chart, holding above the 50-day, 100-day and 200-day Simple Moving Averages (SMAs), reinforcing the broader uptrend.
The cross also remains above the horizontal support at 216.50, while the Relative Strength Index (RSI) stands at 62.54, remaining in bullish territory. Meanwhile, the Moving Average Convergence Divergence (MACD) indicator stays in positive territory at 0.33, suggesting upside momentum remains constructive.
On the upside, immediate resistance is located at the 218.00 horizontal barrier. A sustained break above this level could pave the way for an extension of the broader uptrend.
Initial support is seen at 216.50, followed by the 50-day SMA at 214.31 and the 100-day SMA at 213.51. The 200-day SMA at 210.57 provides the next major support if a deeper corrective pullback unfolds.
US Dollar Price Today
The table below shows the percentage change of US Dollar (USD) against listed major currencies today. US Dollar was the strongest against the Swiss Franc.
| USD | EUR | GBP | JPY | CAD | AUD | NZD | CHF | |
|---|---|---|---|---|---|---|---|---|
| USD | 0.03% | -0.07% | -0.36% | -0.15% | -0.09% | -0.20% | 0.05% | |
| EUR | -0.03% | -0.11% | -0.39% | -0.18% | -0.13% | -0.26% | 0.02% | |
| GBP | 0.07% | 0.11% | -0.28% | -0.07% | -0.03% | -0.15% | 0.11% | |
| JPY | 0.36% | 0.39% | 0.28% | 0.21% | 0.27% | 0.11% | 0.39% | |
| CAD | 0.15% | 0.18% | 0.07% | -0.21% | 0.05% | -0.09% | 0.18% | |
| AUD | 0.09% | 0.13% | 0.03% | -0.27% | -0.05% | -0.13% | 0.11% | |
| NZD | 0.20% | 0.26% | 0.15% | -0.11% | 0.09% | 0.13% | 0.26% | |
| CHF | -0.05% | -0.02% | -0.11% | -0.39% | -0.18% | -0.11% | -0.26% |
The heat map shows percentage changes of major currencies against each other. The base currency is picked from the left column, while the quote currency is picked from the top row. For example, if you pick the US Dollar from the left column and move along the horizontal line to the Japanese Yen, the percentage change displayed in the box will represent USD (base)/JPY (quote).














