
GBP/JPY Price Forecast: Clears key resistance, aims towards 212.00
작성자 Christian Borjon Valencia
게시일: 26 Feb 2026 | 수정일: 26 Feb 2026


인기 기사

The GBP/JPY rallies for the second straight day, up by over 0.80% as Yen weakness extends, as the Japanese Prime Minister Takaichi nominates two slightly “dovish” academics to the Bank of Japan’s board. The cross trades at 211.94, slightly below the day’s high of 212.12.
- GBP/JPY rallies after Sanae Takaichi nominates dovish academics to the Bank of Japan board.
- RSI breaks above 50, signaling renewed bullish momentum after rebound from 100-day SMA.
- Break above 212.00 opens path toward 214.44 and 215.00, with 211.10 key support.
The GBP/JPY rallies for the second straight day, up by over 0.80% as Yen weakness extends, as the Japanese Prime Minister Takaichi nominates two slightly “dovish” academics to the Bank of Japan’s board. The cross trades at 211.94, slightly below the day’s high of 212.12.
GBP/JPY Price Forecast: Technical outlook
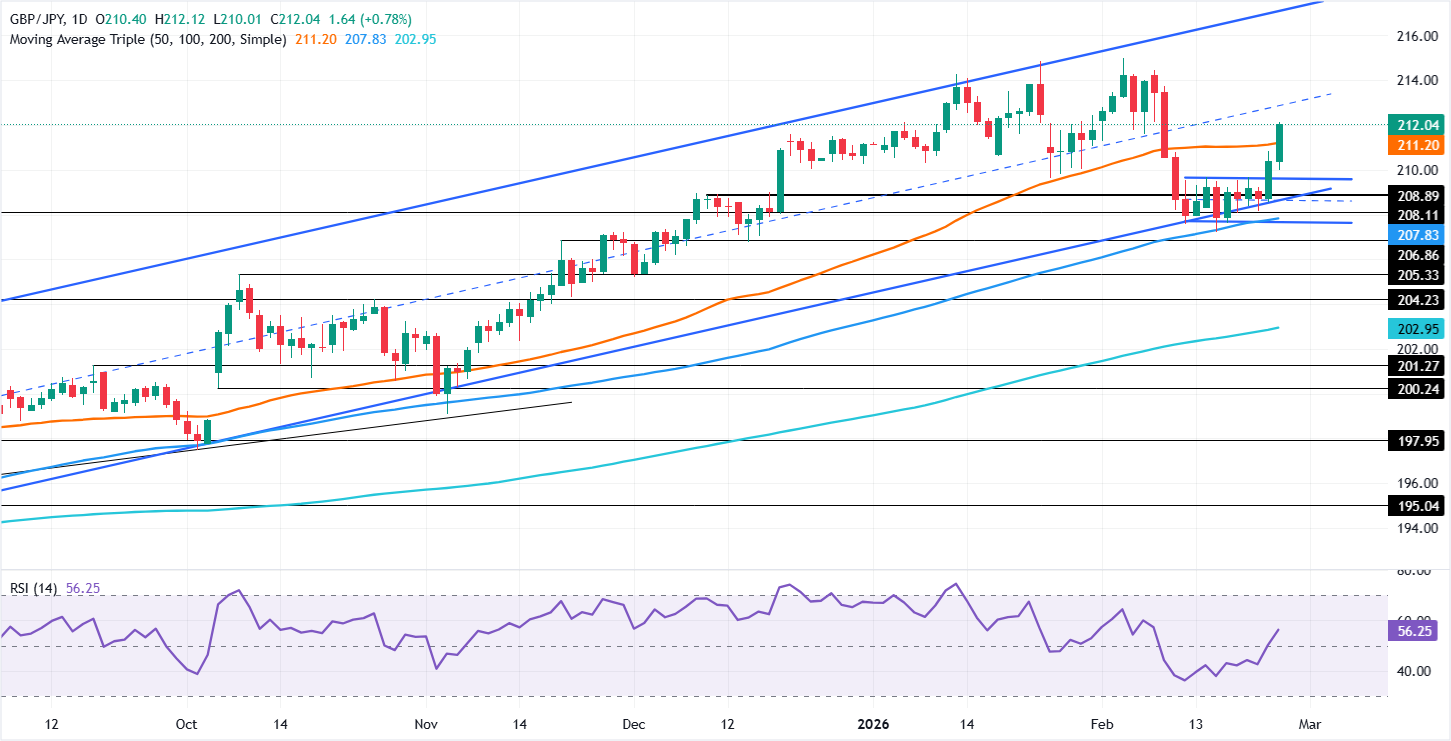
The technical picture shows that the uptrend has resumed, after bottoming near the confluence of the 100-day SMA and a support trendline at around 207.62. Bullish momentum in the GBP/JPY rose as the Relative Strength Index (RSI) crossed aggressively above the 50-neutral level, an indication of buyer’s strength.
GBP/JPY first resistance is 212.00. A breach of the latter will expose the February 9 high at 214.44, followed by the February 4 peak at 215.00. Once cleared, the next stop would be the July 2008 peak at 215.88 ahead of August’s 2007 monthly low, previous support turned resistance at 219.32.
On the downside, support is seen at 50-day SMA at 211.11, followed by the February 16 high turned support at 209.68. Once breached, the next demand zone would be the February 23 daily low of 208.14 ahead of 208.00.
GBP/JPY Price Chart – Daily
Japanese Yen Price Today
The table below shows the percentage change of Japanese Yen (JPY) against listed major currencies today. Japanese Yen was the strongest against the US Dollar.
| USD | EUR | GBP | JPY | CAD | AUD | NZD | CHF | |
|---|---|---|---|---|---|---|---|---|
| USD | -0.26% | -0.41% | 0.38% | -0.17% | -0.85% | -0.52% | -0.12% | |
| EUR | 0.26% | -0.15% | 0.65% | 0.09% | -0.58% | -0.25% | 0.14% | |
| GBP | 0.41% | 0.15% | 0.83% | 0.24% | -0.43% | -0.10% | 0.29% | |
| JPY | -0.38% | -0.65% | -0.83% | -0.53% | -1.21% | -0.86% | -0.48% | |
| CAD | 0.17% | -0.09% | -0.24% | 0.53% | -0.68% | -0.34% | 0.05% | |
| AUD | 0.85% | 0.58% | 0.43% | 1.21% | 0.68% | 0.33% | 0.73% | |
| NZD | 0.52% | 0.25% | 0.10% | 0.86% | 0.34% | -0.33% | 0.40% | |
| CHF | 0.12% | -0.14% | -0.29% | 0.48% | -0.05% | -0.73% | -0.40% |
The heat map shows percentage changes of major currencies against each other. The base currency is picked from the left column, while the quote currency is picked from the top row. For example, if you pick the Japanese Yen from the left column and move along the horizontal line to the US Dollar, the percentage change displayed in the box will represent JPY (base)/USD (quote).

100만 명이 넘는 사용자가 FXStreet를 통해 실시간 시장 데이터, 차트 도구, 전문가 인사이트, 포렉스 뉴스를 이용합니다. 포괄적인 경제 캘린더와 교육 웨비나는 트레이더가 정보를 유지하고 신중한 결정을 내리도록 돕습니다. FXStreet는 바르셀로나 본사와 전 세계 지역에 걸쳐 약 60명의 팀으로 구성되어 있습니다.
더 읽기


