

GBP/JPY Price Forecast: Hold above 217.00, next target is 218.00
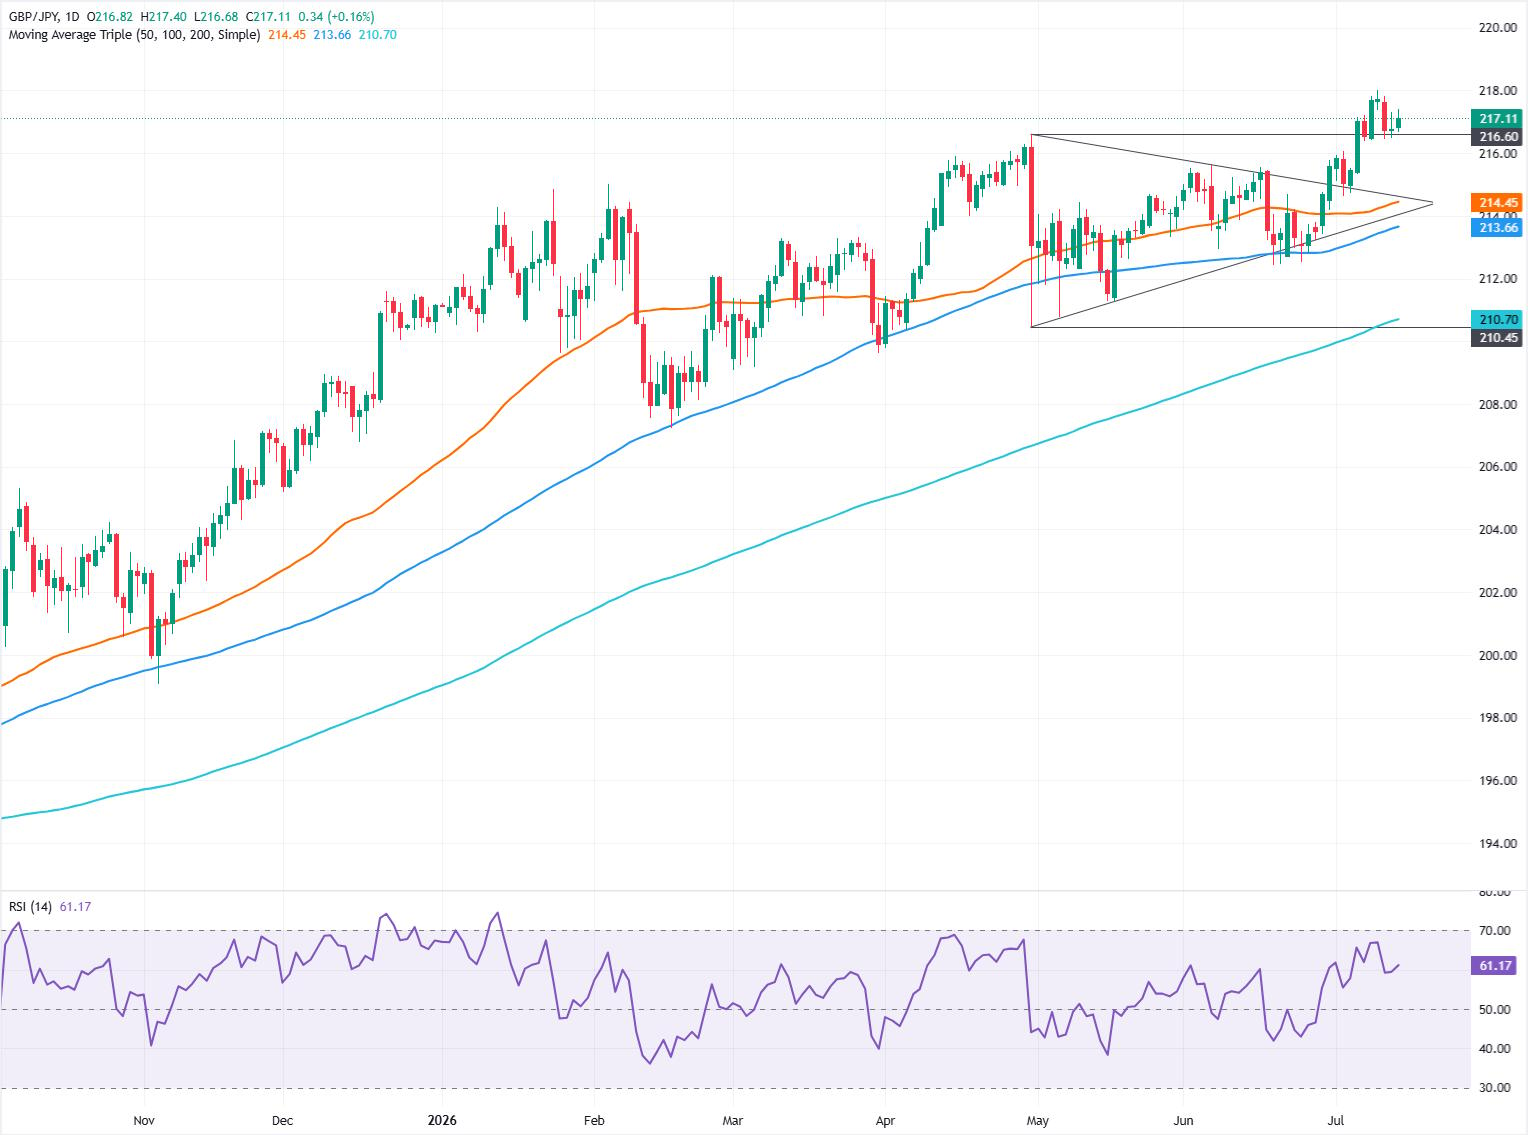
- GBP/JPY consolidates within 217.00-218.00 range after bullish breakout.
- RSI confirms buyers remain in control of near-term momentum.
- Break above 218.00 exposes 219.00 and 220.00 resistance.
The British Pound registers gains against the Japanese Yen on Tuesday, rising by over 0.12% to 217.04, with the cross-pair poised to test the year-to-date (YTD) high of 218.01.
GBP/JPY Price Forecast: Technical outlook
The trend is up, as depicted by price action, as GBP/JPY surpassed the April 30 daily high of 216.60, opening the door to consolidation within the 217.00-218.00 range. Although the technicals suggest that further upside is seen, speculation that Japanese authorities might intervene in the FX markets keeps buyers cautious from opening fresh long bets, which could drive the pair higher.

Momentum as measured by the Relative Strength Index (RSI) shows that buyers are in charge, meaning that further upside is expected.
If GBP/JPY clears 218.00, this paves the way to challenge the 218.50 mark, ahead of 219.00. Once those levels are taken out, the next resistance is 220.00, followed by the January 2008 monthly high of 222.76.
On the other hand, the first support for GBP/JPY is at 217.00. Below this area, the next area of demand would be the April 30 high of the day (HOD) at 216.60. Once cleared, the next stop would be the 216.00 mark, followed by the 215.00 psychological level.
GBP/JPY Price Chart — Daily
Pound Sterling Price This week
The table below shows the percentage change of British Pound (GBP) against listed major currencies this week. British Pound was the strongest against the Japanese Yen.
| USD | EUR | GBP | JPY | CAD | AUD | NZD | CHF | |
|---|---|---|---|---|---|---|---|---|
| USD | -0.17% | -0.00% | 0.34% | -0.65% | -0.35% | -0.79% | 0.13% | |
| EUR | 0.17% | 0.17% | 0.44% | -0.48% | -0.22% | -0.62% | 0.33% | |
| GBP | 0.00% | -0.17% | 0.24% | -0.66% | -0.39% | -0.80% | 0.20% | |
| JPY | -0.34% | -0.44% | -0.24% | -1.00% | -0.59% | -1.08% | -0.14% | |
| CAD | 0.65% | 0.48% | 0.66% | 1.00% | 0.38% | -0.10% | 0.86% | |
| AUD | 0.35% | 0.22% | 0.39% | 0.59% | -0.38% | -0.41% | 0.45% | |
| NZD | 0.79% | 0.62% | 0.80% | 1.08% | 0.10% | 0.41% | 1.00% | |
| CHF | -0.13% | -0.33% | -0.20% | 0.14% | -0.86% | -0.45% | -1.00% |
The heat map shows percentage changes of major currencies against each other. The base currency is picked from the left column, while the quote currency is picked from the top row. For example, if you pick the British Pound from the left column and move along the horizontal line to the US Dollar, the percentage change displayed in the box will represent GBP (base)/USD (quote).














