
GBP/JPY Price Forecast: Rejected at 216.00, risks deepen below 215.00
작성자 Christian Borjon Valencia
수정됨: 23 Apr 2026


인기 기사

GBP/JPY advance stalls around 215.70, then retreats to 215.00 as risk appetite deteriorates amid Middle East headlines, leaving traders uncertain about the conflict's outcome. The cross trades at 215.06 at the time of writing.
- GBP/JPY fails near 216, as repeated rejection pushes the cross lower.
- RSI drifts toward 50, indicating weakening bullish momentum strength.
- Break below 215 exposes 214.00 and 213.35 support levels.
GBP/JPY advance stalls around 215.70, then retreats to 215.00 as risk appetite deteriorates amid Middle East headlines, leaving traders uncertain about the conflict's outcome. The cross trades at 215.06 at the time of writing.
GBP/JPY Price Forecast: Technical Outlook
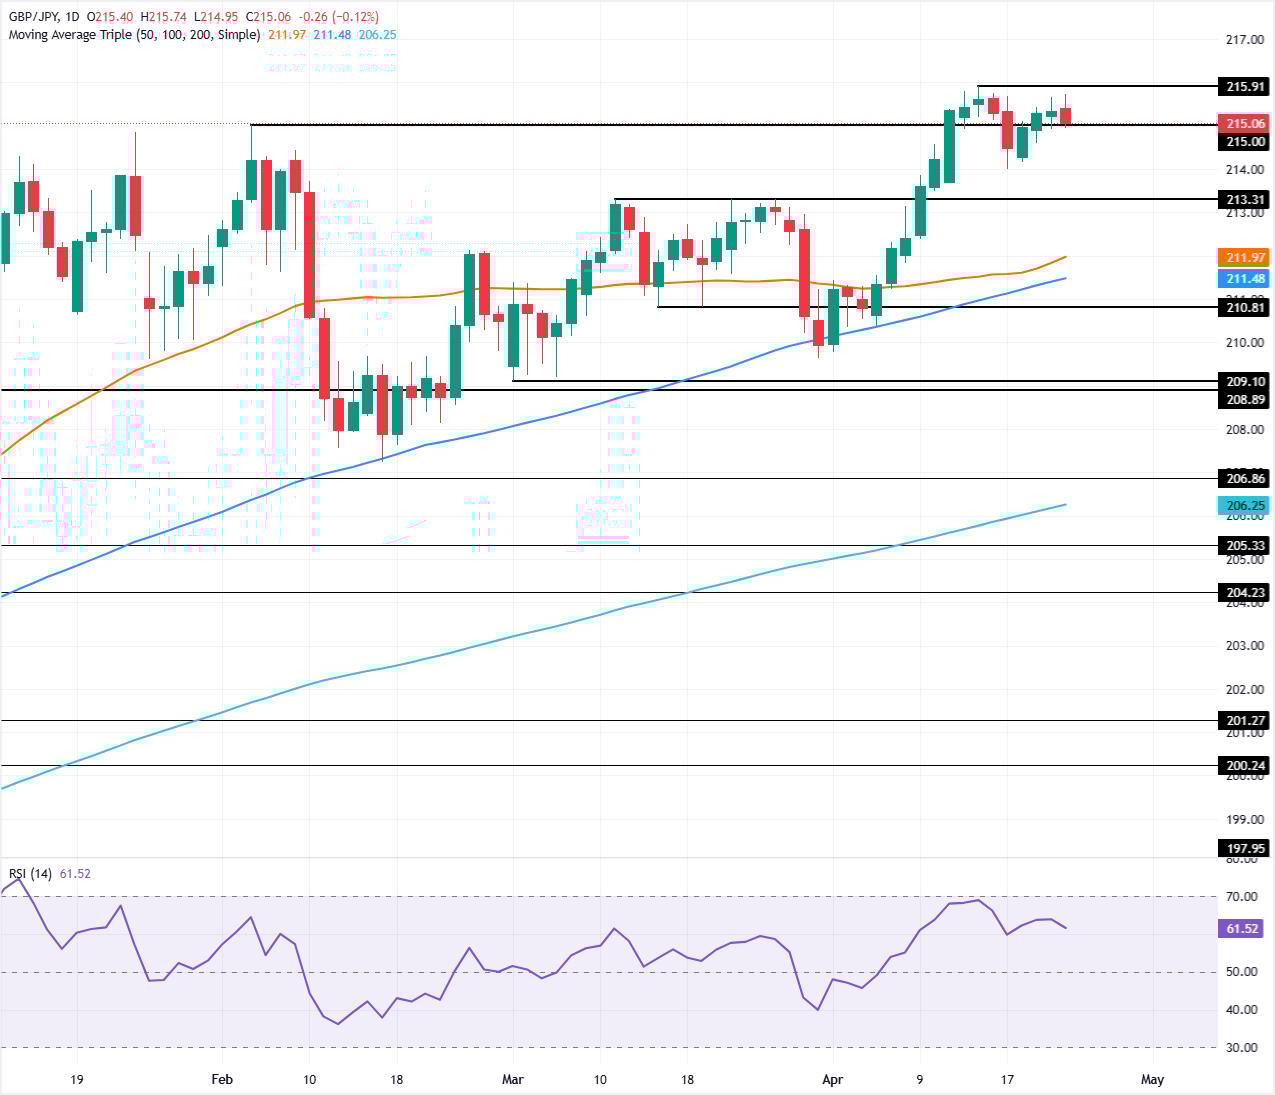
The GBP/JPY is consolidating for the second straight day, suggesting that further gains are off the table, with the psychological 216.00 level not yet tested. Worth noting that every upside move towards the latter was rejected, with the 214.00 figure capping downward moves.
Momentum is bullish, as depicted by the Relative Strength Index (RSI), though moving gradually towards its 50 neutral level.
If GBP/JPY closes daily below 215.00, the potential to test the April 17 swing low of 214.00 increases. On further weakness, the next support would be the 20-day Simple Moving Average (SMA) at 213.35, followed by the 50-day SMA at 211.98.
On the other hand, if GBP/JPY registers a new yearly high above 215.91, the chance of clearing 216.00 increases.
GBP/JPY Price Chart – Daily
Japanese Yen Price This week
The table below shows the percentage change of Japanese Yen (JPY) against listed major currencies this week. Japanese Yen was the strongest against the Swiss Franc.
| USD | EUR | GBP | JPY | CAD | AUD | NZD | CHF | |
|---|---|---|---|---|---|---|---|---|
| USD | 0.50% | 0.17% | 0.59% | 0.09% | -0.05% | 0.15% | 0.64% | |
| EUR | -0.50% | -0.32% | 0.07% | -0.39% | -0.52% | -0.39% | 0.14% | |
| GBP | -0.17% | 0.32% | 0.41% | -0.06% | -0.19% | -0.06% | 0.47% | |
| JPY | -0.59% | -0.07% | -0.41% | -0.51% | -0.58% | -0.45% | 0.07% | |
| CAD | -0.09% | 0.39% | 0.06% | 0.51% | -0.03% | 0.05% | 0.53% | |
| AUD | 0.05% | 0.52% | 0.19% | 0.58% | 0.03% | 0.20% | 0.70% | |
| NZD | -0.15% | 0.39% | 0.06% | 0.45% | -0.05% | -0.20% | 0.50% | |
| CHF | -0.64% | -0.14% | -0.47% | -0.07% | -0.53% | -0.70% | -0.50% |
The heat map shows percentage changes of major currencies against each other. The base currency is picked from the left column, while the quote currency is picked from the top row. For example, if you pick the Japanese Yen from the left column and move along the horizontal line to the US Dollar, the percentage change displayed in the box will represent JPY (base)/USD (quote).

100만 명이 넘는 사용자가 FXStreet를 통해 실시간 시장 데이터, 차트 도구, 전문가 인사이트, 포렉스 뉴스를 이용합니다. 포괄적인 경제 캘린더와 교육 웨비나는 트레이더가 정보를 유지하고 신중한 결정을 내리도록 돕습니다. FXStreet는 바르셀로나 본사와 전 세계 지역에 걸쳐 약 60명의 팀으로 구성되어 있습니다.
더 읽기


