
GBP/JPY Price Forecast: Sellers eye break below 100-day SMA
작성자 Christian Borjon Valencia
수정됨: 18 Jun 2026


인기 기사

The GBP/JPY retreats during the North American session on Thursday, down 0.21% as the Pound Sterling depreciates, despite the Bank of England (BoE) holding rates unchanged. At the time of writing, the cross-pair trades at 213.11 after peaking near 214.06.
- GBP/JPY tests 100-day SMA as Yen momentum improves.
- RSI near 42 signals sellers retain near-term control.
- Break below 212.79 exposes 211.26 and 210.45 supports.
The GBP/JPY retreats during the North American session on Thursday, down 0.21% as the Pound Sterling depreciates, despite the Bank of England (BoE) holding rates unchanged. At the time of writing, the cross-pair trades at 213.11 after peaking near 214.06.
GBP/JPY Price Forecast: Technical outlook
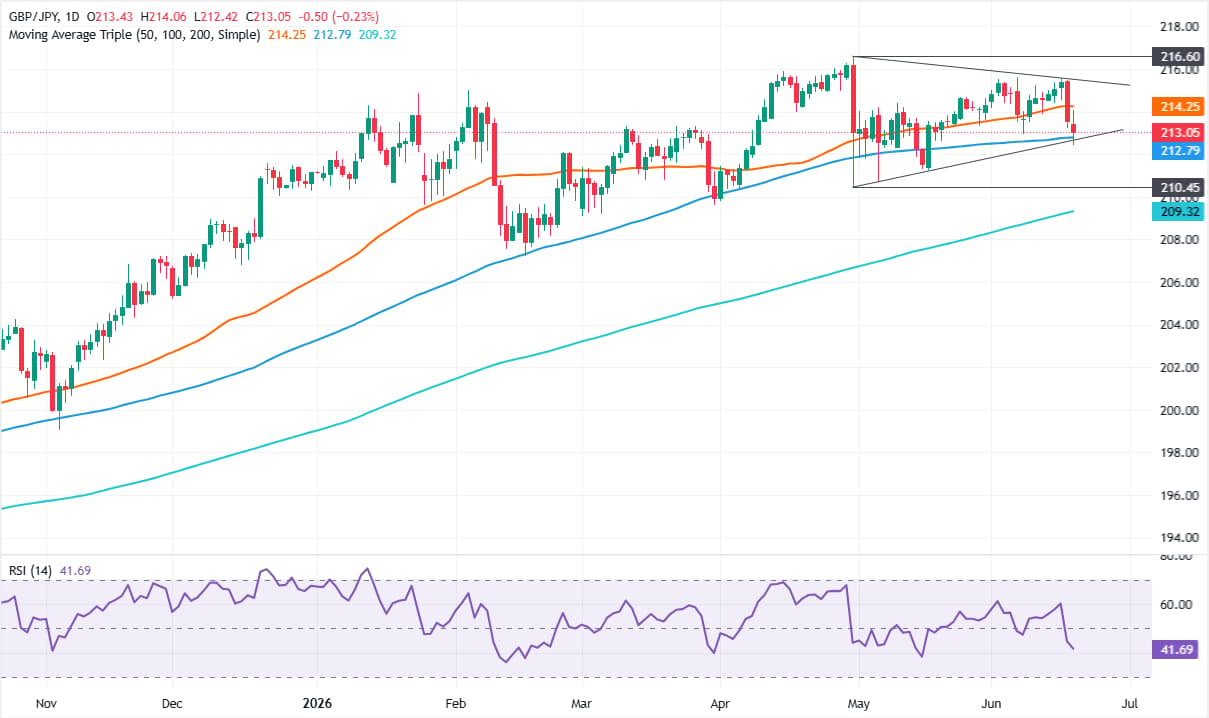
From a price action perspective, the GBP/JPY is neutral-biased, though over the last couple of trading days, the Yen has shown signs of life, driving the cross-pair to test key support at the 100-day Simple Moving Average (SMA) at 212.79.
The Relative Strength Index (RSI) shows that momentum favors further downside, with the index aiming lower, at 41.68. Hence, the GBP/JPY might continue to edge lower.
If GBP/JPY clears decisively the 199-day SMA, the next support would be the May 18 daily low of 211.26. Below sits the April 30 swing low of 210.45, before the cross aims toward the 200-day SMA at 209.32.
On the other hand, GBP/JPY must clear the 50-day SMA at 214.25 to allow buyers to challenge the 215.00 milestone. Up next, the area of interest is the 216.00 mark.
GBP/JPY Price Chart – Daily
Japanese Yen Price This week
The table below shows the percentage change of Japanese Yen (JPY) against listed major currencies this week. Japanese Yen was the strongest against the British Pound.
| USD | EUR | GBP | JPY | CAD | AUD | NZD | CHF | |
|---|---|---|---|---|---|---|---|---|
| USD | 1.01% | 1.58% | 0.74% | 1.03% | 0.40% | 1.26% | 1.02% | |
| EUR | -1.01% | 0.53% | -0.24% | 0.00% | -0.63% | 0.25% | 0.00% | |
| GBP | -1.58% | -0.53% | -0.96% | -0.51% | -1.16% | -0.27% | -0.52% | |
| JPY | -0.74% | 0.24% | 0.96% | 0.27% | -0.35% | 0.55% | 0.26% | |
| CAD | -1.03% | -0.01% | 0.51% | -0.27% | -0.66% | 0.29% | -0.01% | |
| AUD | -0.40% | 0.63% | 1.16% | 0.35% | 0.66% | 0.89% | 0.64% | |
| NZD | -1.26% | -0.25% | 0.27% | -0.55% | -0.29% | -0.89% | -0.25% | |
| CHF | -1.02% | -0.00% | 0.52% | -0.26% | 0.00% | -0.64% | 0.25% |
The heat map shows percentage changes of major currencies against each other. The base currency is picked from the left column, while the quote currency is picked from the top row. For example, if you pick the Japanese Yen from the left column and move along the horizontal line to the US Dollar, the percentage change displayed in the box will represent JPY (base)/USD (quote).

100만 명이 넘는 사용자가 FXStreet를 통해 실시간 시장 데이터, 차트 도구, 전문가 인사이트, 포렉스 뉴스를 이용합니다. 포괄적인 경제 캘린더와 교육 웨비나는 트레이더가 정보를 유지하고 신중한 결정을 내리도록 돕습니다. FXStreet는 바르셀로나 본사와 전 세계 지역에 걸쳐 약 60명의 팀으로 구성되어 있습니다.
더 읽기


