
GBP/JPY Price Forecast: Stalls as bulls eye breakout above 212.73
작성자 Christian Borjon Valencia
게시일: 19 Mar 2026 | 수정일: 19 Mar 2026


인기 기사

GBP/JPY posted minimal gains of 0.02%, seesawing between gains and losses amid a trading session that saw monetary policy decisions from the Bank of Japan and the Bank of England, with both institutions holding rates unchanged. At the time of writing, the cross trades at 212.00, virtually unchanged.
- GBP/JPY flatlines as BoE and BoJ keep policy unchanged.
- Ascending channel and key SMAs support broader bullish bias.
- Break above 212.73 exposes 213.30 and 215.00 levels.
GBP/JPY posted minimal gains of 0.02%, seesawing between gains and losses amid a trading session that saw monetary policy decisions from the Bank of Japan and the Bank of England, with both institutions holding rates unchanged. At the time of writing, the cross trades at 212.00, virtually unchanged.
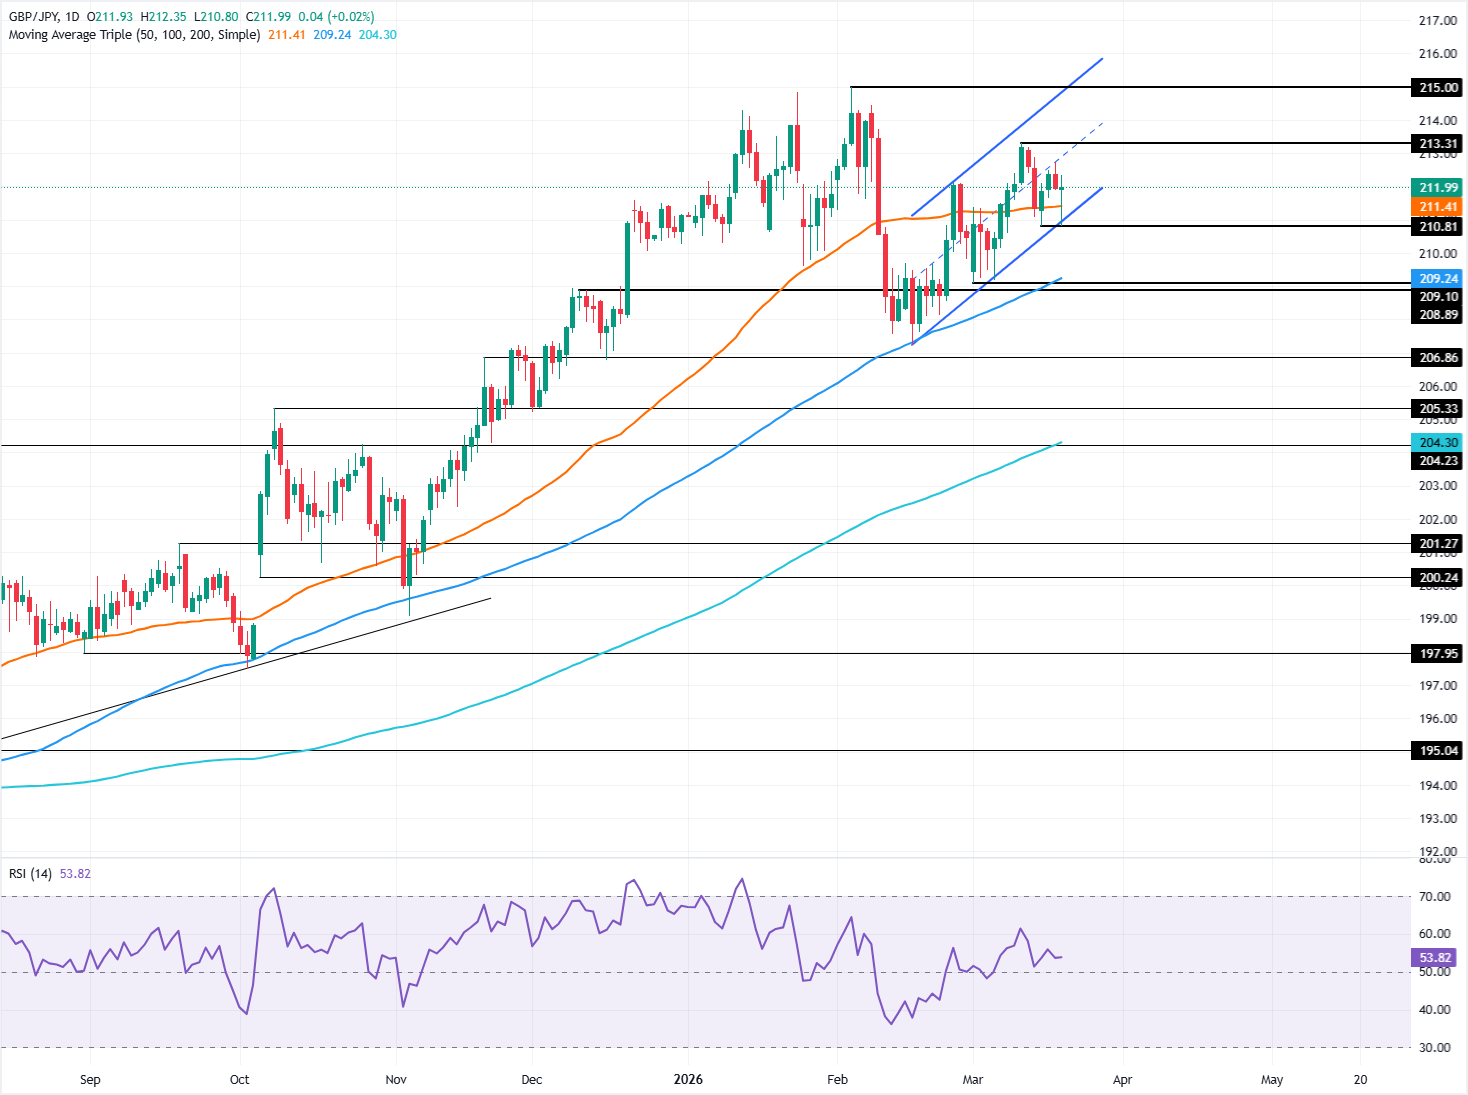
GBP/JPY Price Forecast: Technical Outlook
The GBP/JPY technical picture is bullish-biased, with price action trading within an ascending channel and the 20-, 50-, 100-, and 200-day Simple Moving Averages (SMAs) providing support.
Although momentum is bullish, as depicted by the Relative Strength Index (RSI), it remains close to the neutral level, an indication of choppy trading ahead.
For a bullish continuation, the cross-pair would need to clear the March 18 daily high at 212.73. Once breached, the next stop would be the March 11 high at 213.30, followed by the yearly peak at 215.00.
On the other hand, a break to the downside of the ascending channel, it would target 207.00 before testing the 200-day Simple Moving Average (SMA) at 204.24.
GBP/JPY Price Chart – Daily
Japanese Yen Price This week
The table below shows the percentage change of Japanese Yen (JPY) against listed major currencies this week. Japanese Yen was the strongest against the Canadian Dollar.
| USD | EUR | GBP | JPY | CAD | AUD | NZD | CHF | |
|---|---|---|---|---|---|---|---|---|
| USD | -1.35% | -1.38% | -1.06% | 0.08% | -1.29% | -1.33% | -0.19% | |
| EUR | 1.35% | -0.02% | 0.20% | 1.43% | 0.07% | 0.01% | 1.16% | |
| GBP | 1.38% | 0.02% | 0.36% | 1.45% | 0.10% | 0.04% | 1.25% | |
| JPY | 1.06% | -0.20% | -0.36% | 1.18% | -0.22% | -0.24% | 0.90% | |
| CAD | -0.08% | -1.43% | -1.45% | -1.18% | -1.40% | -1.39% | -0.26% | |
| AUD | 1.29% | -0.07% | -0.10% | 0.22% | 1.40% | -0.06% | 1.10% | |
| NZD | 1.33% | -0.01% | -0.04% | 0.24% | 1.39% | 0.06% | 1.12% | |
| CHF | 0.19% | -1.16% | -1.25% | -0.90% | 0.26% | -1.10% | -1.12% |
The heat map shows percentage changes of major currencies against each other. The base currency is picked from the left column, while the quote currency is picked from the top row. For example, if you pick the Japanese Yen from the left column and move along the horizontal line to the US Dollar, the percentage change displayed in the box will represent JPY (base)/USD (quote).

100만 명이 넘는 사용자가 FXStreet를 통해 실시간 시장 데이터, 차트 도구, 전문가 인사이트, 포렉스 뉴스를 이용합니다. 포괄적인 경제 캘린더와 교육 웨비나는 트레이더가 정보를 유지하고 신중한 결정을 내리도록 돕습니다. FXStreet는 바르셀로나 본사와 전 세계 지역에 걸쳐 약 60명의 팀으로 구성되어 있습니다.
더 읽기


