
GBP/USD holds above 1.3300 as haven bids lift the US Dollar
작성자 Christian Borjon Valencia
수정됨: 27 Mar 2026


인기 기사

The British Pound holds firm during the North American session, clings above the 1.3300 figure, yet seems poised to finish the week with 0.20% losses against the US Dollar.
- GBP/USD clings to 1.3300 as haven demand keeps the US Dollar supported.
- UK Retail Sales slump and BoE caution weigh on Sterling sentiment.
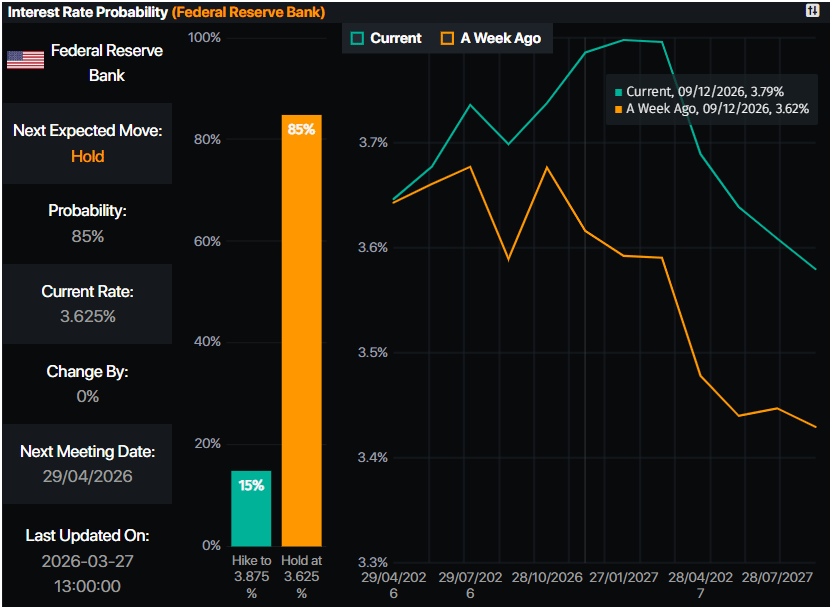
- Markets now see both the Fed and BoE leaning further hawkish.
The British Pound holds firm during the North American session, clings above the 1.3300 figure, yet seems poised to finish the week with 0.20% losses against the US Dollar. Risk aversion due to an energy shock caused by the Middle East conflict and the haven appeal of the Greenback keep GBP/USD on its way to monthly losses of more than 1%.
Sterling eyes weekly loss as Oil, war worries sour sentiment anew
On Thursday, the US President Donald Trump announced a delay in an attack on Iran’s energy facilities for 10 days, until April 6. Initially, the markets cheered the move as Oil prices fell. Nevertheless, WTI reversed the initial drop as traders faded the news.
Hence, sentiment remains dismal, with Wall Street posting losses and the Greenback poised to finish the week with gains of over 0.45%, as revealed by the US Dollar Index (DXY). The DXY, which tracks the buck’s performance versus six other currencies, is at 99.94, virtually unchanged for the day.
Adding to the sour mood was the fact that the Islamic Revolutionary Guard Corps (IRGC) shut off the Strait of Hormuz.
Data from the US showed that American consumers had grown pessimistic about the economy, as the University of Michigan Consumer Sentiment Index dipped from 55.5 to 53.5, below forecasts of 54.0. Inflation expectations for the next twelve months jumped from 3.4% in February to 3.8%, while for the five years dipped from 3.3% to 3.2%.
In the UK, Retail Sales fell in February following January’s strong performance, coming in at -0.4% MoM, a collapse from the previous month’s 1.8% growth.
Aside from this, Bank of England’s Alan Taylor said the bar for hiking interest rates is quite high, revealing that holding rates is preferable until the central bank assesses the impact of Iran’s war on the economy.
Traders expect further tightening by central banks
This week, money markets had priced out the possibility of rate cuts by the Federal Reserve and the Bank of England. Instead, they see the Fed raising rates by 5 basis points towards year-end. The BoE is projected to increase rates by 78 basis points, according to Prime Market Terminal data.
GBP/USD Price Forecast: Technical outlook
In the daily chart, GBP/USD trades at 1.3311. The near-term bias is mildly bearish as spot holds below the clustered simple moving averages near 1.35 and remains capped by the descending resistance line from 1.3869, which has contained every rebound since the recent 1.38 area highs. Price slipping back inside the broad contracting formation between that downtrend line and the still-rising support line from 1.3035 signals fading upside momentum, while the latest downtick in the Fed Sentiment Index above 119.000 hints that relative policy expectations continue to favor the dollar at the margin.
Immediate resistance stands at the descending trend line currently intersecting just above 1.3400, followed by the 1.3500/1.3520 zone where the daily moving averages converge and prior swing highs cluster. A daily close above that confluence would weaken the bearish bias and expose the 1.3700 region, ahead of the 1.3869 high. On the downside, initial support emerges at 1.3220, the latest swing low, with further traction expected around 1.3100 aligned with the rising trend line from 1.3035. A break beneath that structural floor would confirm a deeper bearish extension toward the psychological 1.3000 handle.
(The technical analysis of this story was written with the help of an AI tool.)
Pound Sterling Price This week
The table below shows the percentage change of British Pound (GBP) against listed major currencies this week. British Pound was the strongest against the Australian Dollar.
| USD | EUR | GBP | JPY | CAD | AUD | NZD | CHF | |
|---|---|---|---|---|---|---|---|---|
| USD | -0.04% | -0.11% | 0.26% | 1.06% | 1.44% | 0.93% | 1.05% | |
| EUR | 0.04% | -0.06% | 0.31% | 1.11% | 1.47% | 0.98% | 1.10% | |
| GBP | 0.11% | 0.06% | 0.32% | 1.16% | 1.56% | 1.04% | 1.09% | |
| JPY | -0.26% | -0.31% | -0.32% | 0.78% | 1.17% | 0.64% | 0.70% | |
| CAD | -1.06% | -1.11% | -1.16% | -0.78% | 0.40% | -0.13% | -0.01% | |
| AUD | -1.44% | -1.47% | -1.56% | -1.17% | -0.40% | -0.51% | -0.46% | |
| NZD | -0.93% | -0.98% | -1.04% | -0.64% | 0.13% | 0.51% | 0.05% | |
| CHF | -1.05% | -1.10% | -1.09% | -0.70% | 0.01% | 0.46% | -0.05% |
The heat map shows percentage changes of major currencies against each other. The base currency is picked from the left column, while the quote currency is picked from the top row. For example, if you pick the British Pound from the left column and move along the horizontal line to the US Dollar, the percentage change displayed in the box will represent GBP (base)/USD (quote).

100만 명이 넘는 사용자가 FXStreet를 통해 실시간 시장 데이터, 차트 도구, 전문가 인사이트, 포렉스 뉴스를 이용합니다. 포괄적인 경제 캘린더와 교육 웨비나는 트레이더가 정보를 유지하고 신중한 결정을 내리도록 돕습니다. FXStreet는 바르셀로나 본사와 전 세계 지역에 걸쳐 약 60명의 팀으로 구성되어 있습니다.
더 읽기


