
GBP/USD Price Forecast: More downside looks likely towards 1.3240
작성자 Sagar Dua
수정됨: 8 Jun 2026


인기 기사

The GBP/USD pair trades marginally lower to near 1.3338 during the European trading session on Monday. The pair posts a fresh almost three-week low near 1.3316 in the day, as the US Dollar (USD) outperforms amid growing expectations that the Federal Reserve (Fed) will raise interest rates this year.
- GBP/USD slides to a fresh almost three-week low near 1.3316 as the US Dollar strengthens.
- The odds of the Fed hiking interest rates at least once this year have increased to 74.2%.
- Investors await the US CPI data for May and the UK GDP data for April.
The GBP/USD pair trades marginally lower to near 1.3338 during the European trading session on Monday. The pair posts a fresh almost three-week low near 1.3316 in the day, as the US Dollar (USD) outperforms amid growing expectations that the Federal Reserve (Fed) will raise interest rates this year.
During press time, the US Dollar Index (DXY), which tracks the Greenback’s value against six major currencies, holds onto Friday’s gains near 100.10.
US Dollar Price Last 7 Days
The table below shows the percentage change of US Dollar (USD) against listed major currencies last 7 days. US Dollar was the strongest against the New Zealand Dollar.
| USD | EUR | GBP | JPY | CAD | AUD | NZD | CHF | |
|---|---|---|---|---|---|---|---|---|
| USD | 1.18% | 0.96% | 0.53% | 1.08% | 1.71% | 2.90% | 2.13% | |
| EUR | -1.18% | -0.23% | -0.65% | -0.10% | 0.52% | 1.72% | 0.94% | |
| GBP | -0.96% | 0.23% | -0.38% | 0.12% | 0.75% | 1.95% | 1.15% | |
| JPY | -0.53% | 0.65% | 0.38% | 0.58% | 1.21% | 2.37% | 1.59% | |
| CAD | -1.08% | 0.10% | -0.12% | -0.58% | 0.60% | 1.79% | 1.02% | |
| AUD | -1.71% | -0.52% | -0.75% | -1.21% | -0.60% | 1.19% | 0.42% | |
| NZD | -2.90% | -1.72% | -1.95% | -2.37% | -1.79% | -1.19% | -0.78% | |
| CHF | -2.13% | -0.94% | -1.15% | -1.59% | -1.02% | -0.42% | 0.78% |
The heat map shows percentage changes of major currencies against each other. The base currency is picked from the left column, while the quote currency is picked from the top row. For example, if you pick the US Dollar from the left column and move along the horizontal line to the Japanese Yen, the percentage change displayed in the box will represent USD (base)/JPY (quote).
The CME FedWatch tool shows that the possibility of the Fed delivering at least one interest rate hike this year has increased to 74.2% from 45.2% seen a week ago.
Hawkish Fed bets have escalated following the release of the surprisingly strong United States (US) Nonfarm Payrolls (NFP) data for May on Friday, which showed that the economy created 172K fresh jobs, significantly higher than 85K estimates.
This week, major triggers for the GBP/USD pair will be the US Consumer Price Index (CPI) data for May and the United Kingdom (UK) Gross Domestic Product (GDP) data for April, which will be released on Wednesday and Friday, respectively.
GBP/USD technical analysis
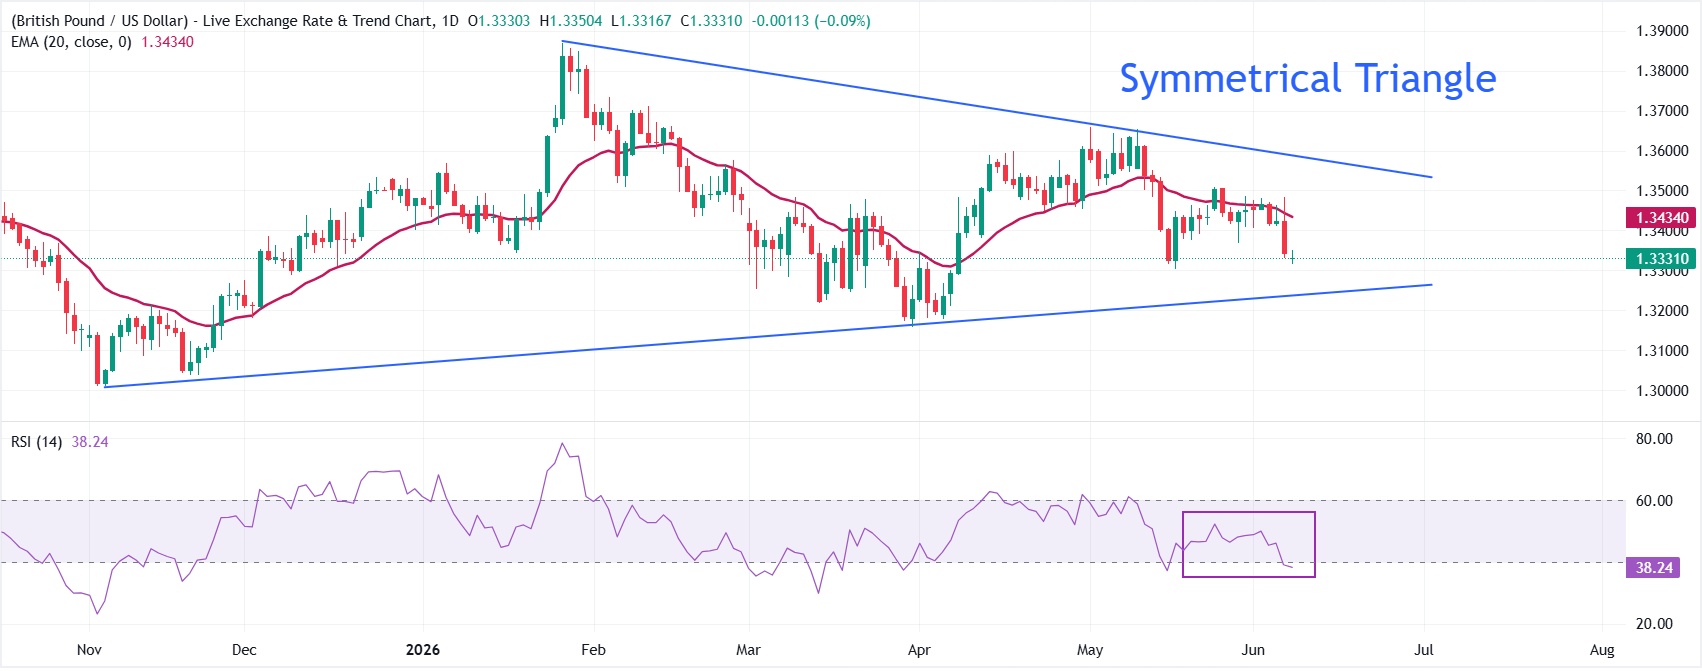
GBP/USD trades lower at around 1.3330 with a bearish near-term bias, holding beneath the 20-day Exponential Moving Average (EMA) at 1.3434. The overall trend appears to be sideways amid a Symmetrical Triangle formation.
The pair has slipped away from its recent consolidation highs, and the Relative Strength Index (RSI) near 38 hints at building downside pressure rather than an imminent recovery while price remains capped by these overhead levels.
On the topside, initial resistance is located at the 20-day EMA at 1.3434, with a break above that exposing the descending resistance trend line near 1.3585 as the next hurdle. On the downside, the former rising support structure is now tracked by the break area around 1.3239, which acts as the first meaningful support level; a clear drop through this zone would likely open the way to a deeper bearish extension towards 1.3200.
(The technical analysis of this story was written with the help of an AI tool.)
Economic Indicator
Gross Domestic Product (MoM)
The Gross Domestic Product (GDP), released by the Office for National Statistics on a monthly and quarterly basis, is a measure of the total value of all goods and services produced in the UK during a given period. The GDP is considered as the main measure of UK economic activity. The MoM reading compares economic activity in the reference month to the previous month. Generally, a rise in this indicator is bullish for the Pound Sterling (GBP), while a low reading is seen as bearish.
Read more.Next release: Fri Jun 12, 2026 06:00
Frequency: Monthly
Consensus: -0.1%
Previous: 0.3%
Source: Office for National Statistics

100만 명이 넘는 사용자가 FXStreet를 통해 실시간 시장 데이터, 차트 도구, 전문가 인사이트, 포렉스 뉴스를 이용합니다. 포괄적인 경제 캘린더와 교육 웨비나는 트레이더가 정보를 유지하고 신중한 결정을 내리도록 돕습니다. FXStreet는 바르셀로나 본사와 전 세계 지역에 걸쳐 약 60명의 팀으로 구성되어 있습니다.
더 읽기


