
GBP/USD Price Forecast: Overall trend appears sideways amid Triangle formation
작성자 Sagar Dua
수정됨: 9 Jun 2026


인기 기사

The GBP/USD pair trades 0.26% higher at around 1.3375 during the European trading session on Tuesday. The Cable gains as the US Dollar (USD) declines amid expectations that the United States (US) could reach a deal with Iran soon.
- GBP/USD rises to near 1.3375 as the US Dollar corrects sharply.
- US President Trump sees a total victory over Iran in the next two weeks.
- Investors await the US CPI data for May and the UK GDP data for April.
The GBP/USD pair trades 0.26% higher at around 1.3375 during the European trading session on Tuesday. The Cable gains as the US Dollar (USD) declines amid expectations that the United States (US) could reach a deal with Iran soon.
US Dollar Price Today
The table below shows the percentage change of US Dollar (USD) against listed major currencies today. US Dollar was the weakest against the New Zealand Dollar.
| USD | EUR | GBP | JPY | CAD | AUD | NZD | CHF | |
|---|---|---|---|---|---|---|---|---|
| USD | -0.12% | -0.20% | -0.03% | -0.14% | -0.26% | -0.54% | -0.20% | |
| EUR | 0.12% | -0.06% | 0.09% | -0.02% | -0.11% | -0.40% | -0.06% | |
| GBP | 0.20% | 0.06% | 0.17% | 0.06% | -0.07% | -0.32% | 0.00% | |
| JPY | 0.03% | -0.09% | -0.17% | -0.11% | -0.22% | -0.50% | -0.16% | |
| CAD | 0.14% | 0.02% | -0.06% | 0.11% | -0.11% | -0.37% | -0.05% | |
| AUD | 0.26% | 0.11% | 0.07% | 0.22% | 0.11% | -0.26% | 0.06% | |
| NZD | 0.54% | 0.40% | 0.32% | 0.50% | 0.37% | 0.26% | 0.32% | |
| CHF | 0.20% | 0.06% | -0.01% | 0.16% | 0.05% | -0.06% | -0.32% |
The heat map shows percentage changes of major currencies against each other. The base currency is picked from the left column, while the quote currency is picked from the top row. For example, if you pick the US Dollar from the left column and move along the horizontal line to the Japanese Yen, the percentage change displayed in the box will represent USD (base)/JPY (quote).
As of writing, the US Dollar Index (DXY), which tracks the Greenback’s value against six major currencies, trades 0.17% lower to near 99.83.
On late Monday, US President Donald Trump expressed confidence that a “total victory” on Iran can be announced in two weeks, adding it would lead to a sharp decline in oil prices. The statement from Trump came after Iran agreed to halt attacking the Israeli territory, which led to a sharp decline in oil prices.
The US Dollar has outperformed in the past few months as elevated oil prices due to the energy supply crisis prompted the US inflation and hawkish Federal Reserve (Fed) bets.
The appeal of currencies from economies, such as the United Kingdom (UK), which rely heavily on oil imports to meet their energy needs, improves when oil prices start falling.
Going forward, investors will focus on the US Consumer Price Index (CPI) data for May and the UK Gross Domestic Product (GDP) data for April, which will be released on Wednesday and Friday, respectively.
GBP/USD technical analysis
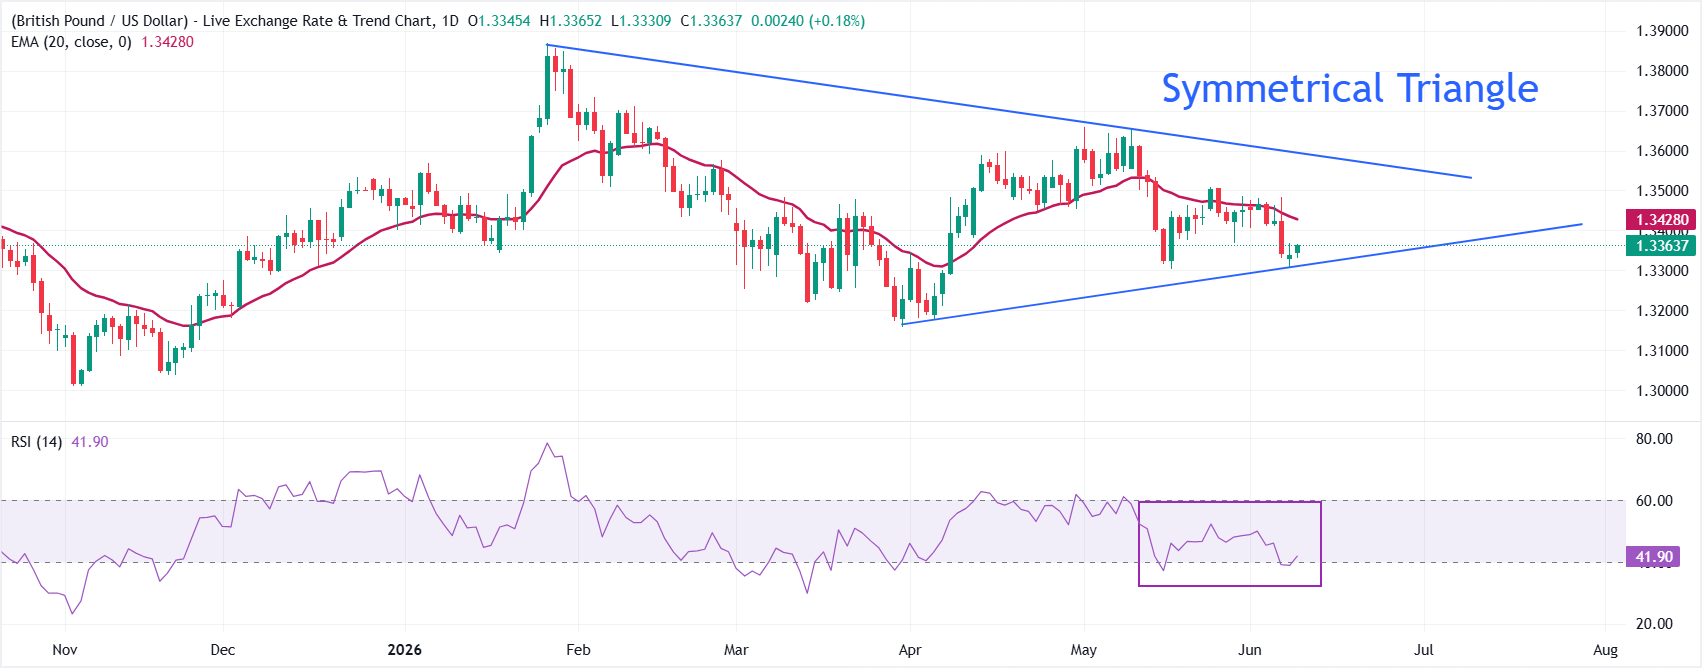
GBP/USD trades higher at around 1.3375 at the press time. However, the near-term tone remains bearish as it holds below the 20-period Exponential Moving Average (EMA), which is at 1.3428. The pair sits between an upward support trend line break around 1.3312 and the reclaimed downward resistance trend line reference at 1.3593, exhibiting a broader sideways trend. The Relative Strength Index (RSI) near 42 leans soft, hinting that downside pressure persists even if not yet overstretched.
On the topside, initial resistance is located at the 20-EMA around 1.3430, and a sustained break above this barrier would open the way toward the former downtrend resistance line reference near 1.3590. On the downside, immediate support emerges at the prior uptrend support break zone around 1.3301, and a drop below there would expose lower levels. The major support area would be the April 7 low at 1.3217, followed by the March 31 low at 1.3159.
(The technical analysis of this story was written with the help of an AI tool.)
Economic Indicator
Gross Domestic Product (MoM)
The Gross Domestic Product (GDP), released by the Office for National Statistics on a monthly and quarterly basis, is a measure of the total value of all goods and services produced in the UK during a given period. The GDP is considered as the main measure of UK economic activity. The MoM reading compares economic activity in the reference month to the previous month. Generally, a rise in this indicator is bullish for the Pound Sterling (GBP), while a low reading is seen as bearish.
Read more.Next release: Fri Jun 12, 2026 06:00
Frequency: Monthly
Consensus: -0.1%
Previous: 0.3%
Source: Office for National Statistics

100만 명이 넘는 사용자가 FXStreet를 통해 실시간 시장 데이터, 차트 도구, 전문가 인사이트, 포렉스 뉴스를 이용합니다. 포괄적인 경제 캘린더와 교육 웨비나는 트레이더가 정보를 유지하고 신중한 결정을 내리도록 돕습니다. FXStreet는 바르셀로나 본사와 전 세계 지역에 걸쳐 약 60명의 팀으로 구성되어 있습니다.
더 읽기


