
GBP/USD Price Forecast: Trades above 1.3500 after rebounding from 50-day EMA
작성자 Akhtar Faruqui
게시일: 6 Feb 2026 | 수정일: 6 Feb 2026


인기 기사

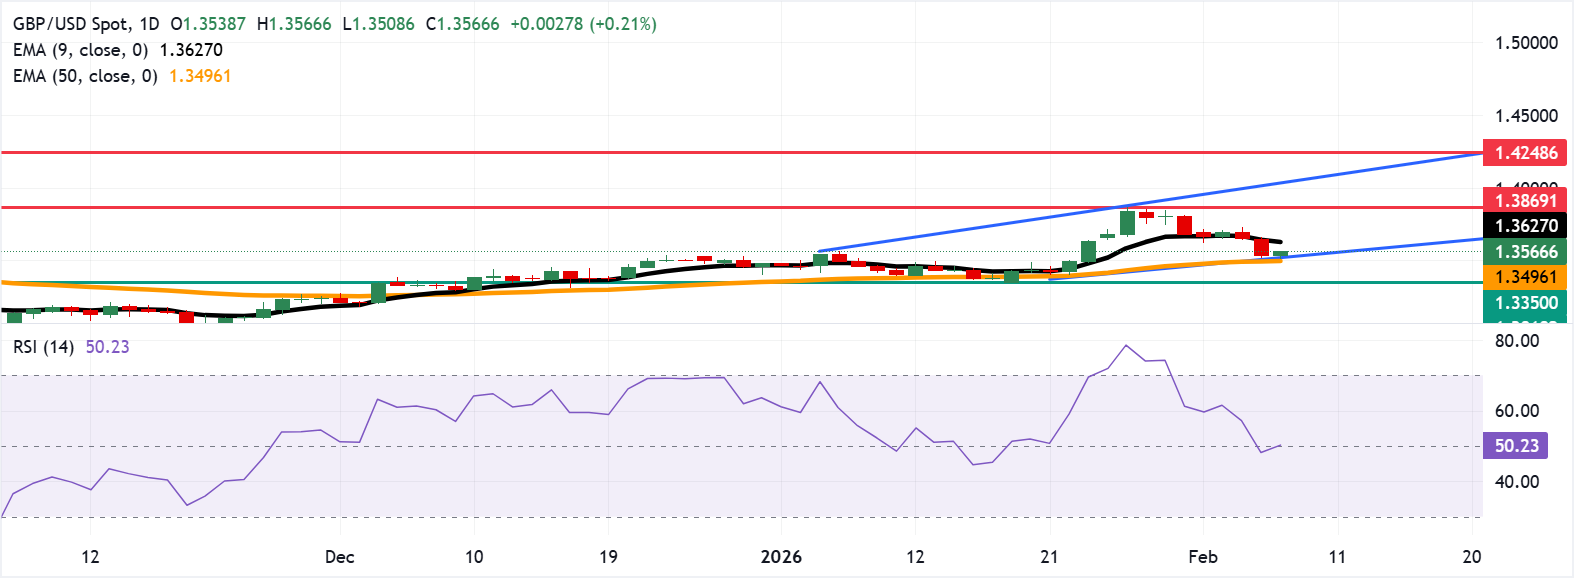
GBP/USD rebounds after two days of gains, trading around 1.3560 during the Asian hours on Friday. The technical analysis of the daily chart points to a potential bearish reversal as the pair is positioned near the lower boundary of an ascending channel pattern.
- GBP/USD rebounded from support near 1.3520 at the channel base, followed by the 50-day EMA.
- The 14-day Relative Strength Index holds at 50 signals neutral momentum.
- The initial resistance lies at the nine-day EMA of 1.3626.
GBP/USD rebounds after two days of gains, trading around 1.3560 during the Asian hours on Friday. The technical analysis of the daily chart points to a potential bearish reversal as the pair is positioned near the lower boundary of an ascending channel pattern.
The 14-day Relative Strength Index (RSI), a momentum indicator, at 50 is neutral. RSI hovering around the midline would turn more supportive on a move above 50 and weaken below it.
The GBP/USD pair holds above the rising 50-day Exponential Moving Average (EMA) at 1.3496, while capped by the nine-day EMA at 1.3626. The short-term average is rolling over, restraining upside as the medium-term slope stays positive. The moving average structure keeps the broader tone supported, yet near-term traction is fading and favors consolidation before direction resumes.
The immediate support is seen at the lower boundary of the ascending channel around 1.3520, followed by the 50-day EMA at 1.3496. A break beneath the longer average would strengthen the bearish bias and put downward pressure on the GBP/USD pair to test the support reversal zone around 1.3350.
On the upside, the GBP/USD pair may target the nine-day EMA of 1.3626. A daily close above the short-term average could unlock a move toward resistance at 1.3869, the highest since September 2021, reached on January 27. Further advances would support the pair to test the upper boundary of the ascending channel around 1.4050. A break above the channel could open a fresh leg higher toward 1.4248, the highest since April 2018.
(The technical analysis of this story was written with the help of an AI tool.)
Pound Sterling Price Today
The table below shows the percentage change of British Pound (GBP) against listed major currencies today. British Pound was the strongest against the US Dollar.
| USD | EUR | GBP | JPY | CAD | AUD | NZD | CHF | |
|---|---|---|---|---|---|---|---|---|
| USD | -0.14% | -0.21% | -0.20% | -0.03% | -0.11% | -0.22% | -0.22% | |
| EUR | 0.14% | -0.07% | -0.07% | 0.10% | 0.03% | -0.08% | -0.07% | |
| GBP | 0.21% | 0.07% | 0.00% | 0.19% | 0.10% | -0.01% | -0.01% | |
| JPY | 0.20% | 0.07% | 0.00% | 0.18% | 0.10% | -0.01% | 0.00% | |
| CAD | 0.03% | -0.10% | -0.19% | -0.18% | -0.08% | -0.19% | -0.17% | |
| AUD | 0.11% | -0.03% | -0.10% | -0.10% | 0.08% | -0.11% | -0.11% | |
| NZD | 0.22% | 0.08% | 0.01% | 0.01% | 0.19% | 0.11% | 0.00% | |
| CHF | 0.22% | 0.07% | 0.00% | 0.00% | 0.17% | 0.11% | -0.00% |
The heat map shows percentage changes of major currencies against each other. The base currency is picked from the left column, while the quote currency is picked from the top row. For example, if you pick the British Pound from the left column and move along the horizontal line to the US Dollar, the percentage change displayed in the box will represent GBP (base)/USD (quote).

100만 명이 넘는 사용자가 FXStreet를 통해 실시간 시장 데이터, 차트 도구, 전문가 인사이트, 포렉스 뉴스를 이용합니다. 포괄적인 경제 캘린더와 교육 웨비나는 트레이더가 정보를 유지하고 신중한 결정을 내리도록 돕습니다. FXStreet는 바르셀로나 본사와 전 세계 지역에 걸쳐 약 60명의 팀으로 구성되어 있습니다.
더 읽기


