
GBP/USD Price Forecast: Treading water around 1.3400 with central banks in focus
작성자 Guillermo Alcala
수정됨: 16 Jun 2026


인기 기사

The British Pound (GBP) is trading practically flat against the US Dollar (USD) on Tuesday.
- GBP/USD keeps hovering around 1.3400, lacking a clear bias.
- Investors await details from the US-Iran deal and interest rate decisions by the Fed and the BoE.
- Technically, the pair is in a consolidating phase, trapped between 1.3300 and 1.3500.
The British Pound (GBP) is trading practically flat against the US Dollar (USD) on Tuesday. The Doji candles at the 1.3400 area highlight an indecisive market, as traders await details on the US-Iran peace deal and monetary policy decisions by the US Federal Reserve (Fed) and the Bank of England (BoE) to make investment decisions.
US Vice President JD Vance affirmed earlier on the day that no tolls will be applied to vessels crossing the Strait of Hormuz and that nuclear inspectors will return to Iran. Investors, however, remain reluctant to take excessive risks, awaiting confirmation from Tehran.+
Markets are also attentive to the interest rate decisions from the Fed and the BoE to assess how major central banks will react to the peace deal. The Fed is expected to keep rates on hold on Wednesday, with the new Chairman Kevin Warsh, likely to adopt a more dovish stance than his predecessor Jerome Powell.
On Thursday, the BoE is highly likely to follow suit on rates and to hint at a steady monetary policy for the coming months. In this case, the vote split and the minutes of the meeting are expected to provide further details about the bank’s forward guidance.
Technical Analysis: Key levels are 1.3300 and 1.3500
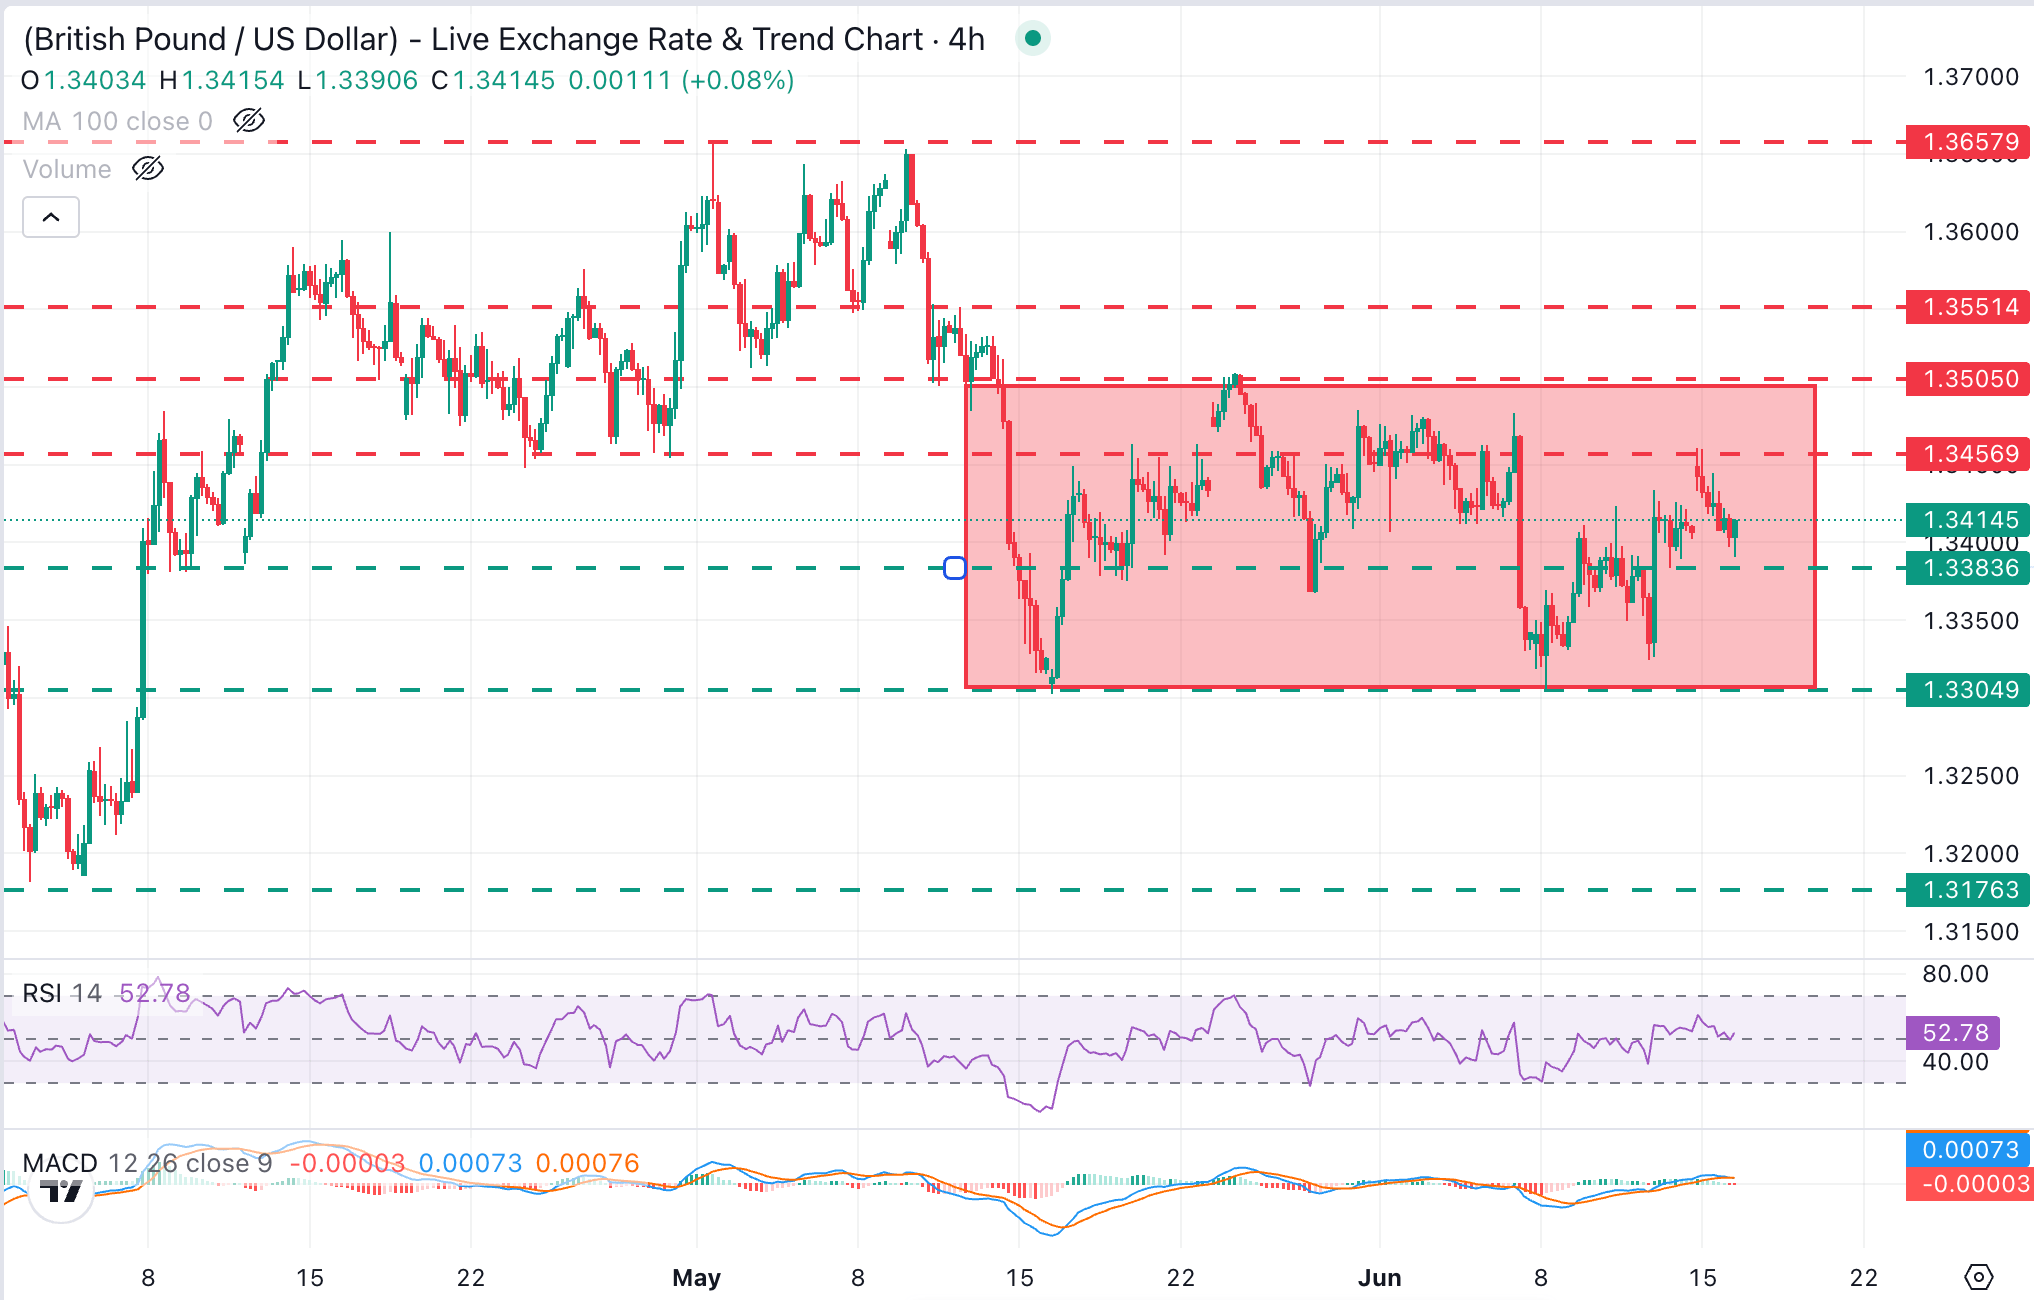
GBP/USD trades at 1.3410, halfway through the last four weeks' range, between 1.3300 and 1.3500. Indicators in the 4-hour chart highlight a lack of clear momentum, with the Relative Strength Index (RSI) flat at the 50 midline and the Moving Average Convergence Divergence (MACD) fractionally below zero, together hinting at a consolidative bias.
The pair was rejected at the 1.3460 area on Monday, although the key resistance area lies between 1.3485 and 1.3505, which has held bulls since mid-May. Further up, the next target is the May 14 high, near 1.3550.
On the downside, Friday's low, at 1.3380, might provide some support ahead of the bottom of the range, at the 1.3300 area (May 18, June 8 lows). Below here, the next bearish target is the late March to early April lows around 1.3170.
(The technical analysis of this story was written with the help of an AI tool.)
US Dollar Price Today
The table below shows the percentage change of US Dollar (USD) against listed major currencies today. US Dollar was the strongest against the Australian Dollar.
| USD | EUR | GBP | JPY | CAD | AUD | NZD | CHF | |
|---|---|---|---|---|---|---|---|---|
| USD | -0.03% | -0.00% | -0.05% | 0.09% | 0.18% | 0.07% | 0.03% | |
| EUR | 0.03% | 0.03% | 0.02% | 0.13% | 0.20% | 0.10% | 0.07% | |
| GBP | 0.00% | -0.03% | 0.00% | 0.11% | 0.16% | 0.08% | 0.04% | |
| JPY | 0.05% | -0.02% | 0.00% | 0.11% | 0.19% | 0.10% | 0.08% | |
| CAD | -0.09% | -0.13% | -0.11% | -0.11% | 0.08% | -0.03% | -0.06% | |
| AUD | -0.18% | -0.20% | -0.16% | -0.19% | -0.08% | -0.09% | -0.12% | |
| NZD | -0.07% | -0.10% | -0.08% | -0.10% | 0.03% | 0.09% | -0.03% | |
| CHF | -0.03% | -0.07% | -0.04% | -0.08% | 0.06% | 0.12% | 0.03% |
The heat map shows percentage changes of major currencies against each other. The base currency is picked from the left column, while the quote currency is picked from the top row. For example, if you pick the US Dollar from the left column and move along the horizontal line to the Japanese Yen, the percentage change displayed in the box will represent USD (base)/JPY (quote).

100만 명이 넘는 사용자가 FXStreet를 통해 실시간 시장 데이터, 차트 도구, 전문가 인사이트, 포렉스 뉴스를 이용합니다. 포괄적인 경제 캘린더와 교육 웨비나는 트레이더가 정보를 유지하고 신중한 결정을 내리도록 돕습니다. FXStreet는 바르셀로나 본사와 전 세계 지역에 걸쳐 약 60명의 팀으로 구성되어 있습니다.
더 읽기


