

Gold climbs on US‑Iran ceasefire progress as Fed rate hike bets fade
- US-Iran deal hopes pressure Oil, easing global inflation risks.
- Chicago PMI jump signals renewed strength in US manufacturing.
- Fed hike bets fade, but sticky Core PCE remains.
Gold (XAU/USD) price advanced more than 1.50% on Friday amid news that Iran and the US are close to signing a deal aimed at extending the ceasefire for 60 days to allow negotiations on Iran’s nuclear program. At the time of writing, XAU/USD trades at $4,563, after bouncing off daily lows of $4,489.

XAU/USD jumps as ceasefire hopes ease inflation fears
Sources familiar with thenegotiations revealed that if an agreement is reached, the Strait of Hormuz will reopen and the US Navy will lift its blockade, allowing the free passage of vessels through the strait. Meanwhile, US President Donald Trump said that he would be in the Situation Room “to make a final determination” about the agreement. Reuters reported that a senior Iranian source said a political understanding on the war has been reached between the two sides, but it is not yet finalised.
The news pushed Oil prices lower, as West Texas Intermediate (WTI) lost over 1.50%, with traders seemingly confident of a diplomatic ending, which would free petrol sitting near the Persian Gulf and ease a global energy shock.
Consequently, inflationary pressures would be tempered, relieving major central banks worldwide, which are considering tightening policy due to the jump in energy prices.
Data-wise, the US economic docket showed that the trade deficit narrowed and that business activity in the Midwest is back in expansionary territory. The Chicago Purchasers Managers’ Index (PMI) rose to 62.7 in May from 49.2 the previous month, surpassing the 50.5 forecast and indicating that the manufacturing sector is gaining steam.
A day ago, economic data showed that the US economy is losing momentum, as first-quarter 2026 GDP dipped to 1.6% from the initial estimate of 2%. On the contrary, inflation continues to edge higher as the Federal Reserve’s (Fed) preferred inflation gauge, the core PCE Price Index, rose by 3.3% YoY in April, up from 3.2% in March.
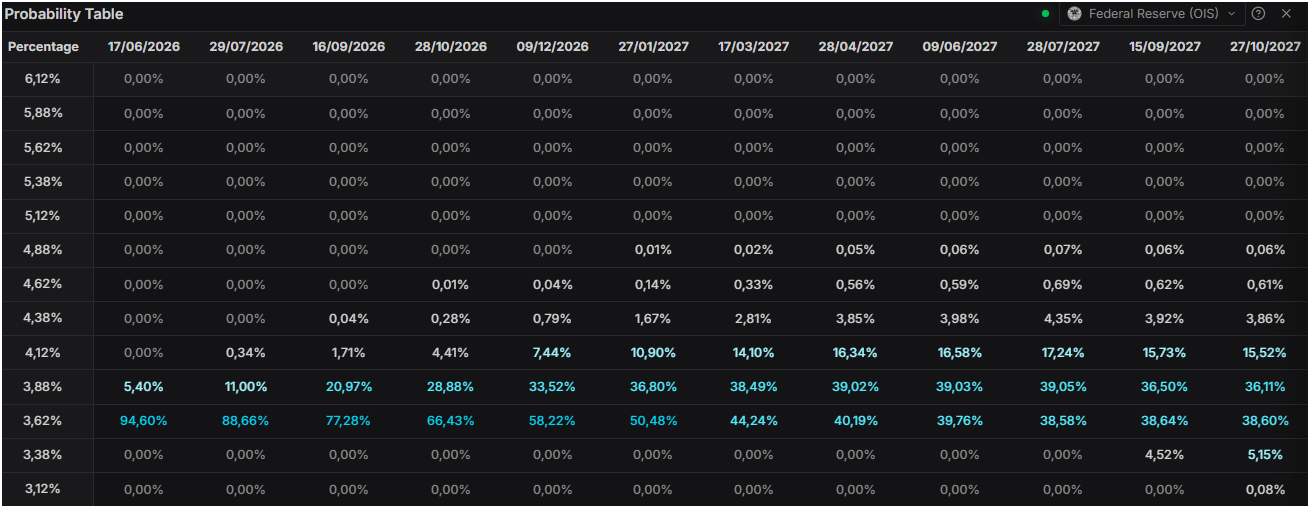
Money markets have trimmed hawkish bets on the Federal Reserve and now expect the US central bank to hold rates unchanged, with odds of a rate hike around 42%, according to Prime Terminal data.
Meanwhile, Fed officials crossed the wires, with San Francisco Fed Mary Daly saying that it is “important for the Fed to restore price stability, but not at the expense of harming the economy.” Her colleague, Philadelphia Fed President Anna Paulson, said inflationary pressures are weighing on the economy, making it tough for firms to plan for the future.
Earlier, Fed Governor Michelle Bowman said that disinflation has slowed and that she might change the policy stance if inflation driven by the war persists. Meanwhile, Kansas City Fed's Jeffrey Schmid indicated that the US central bank must think about ways to tighten monetary policy further, cautioning against viewing the Oil shock as temporary.
Next week, Gold traders will eye the release of the ISM Manufacturing and Services PMIs and the release of May’s Nonfarm Payrolls.
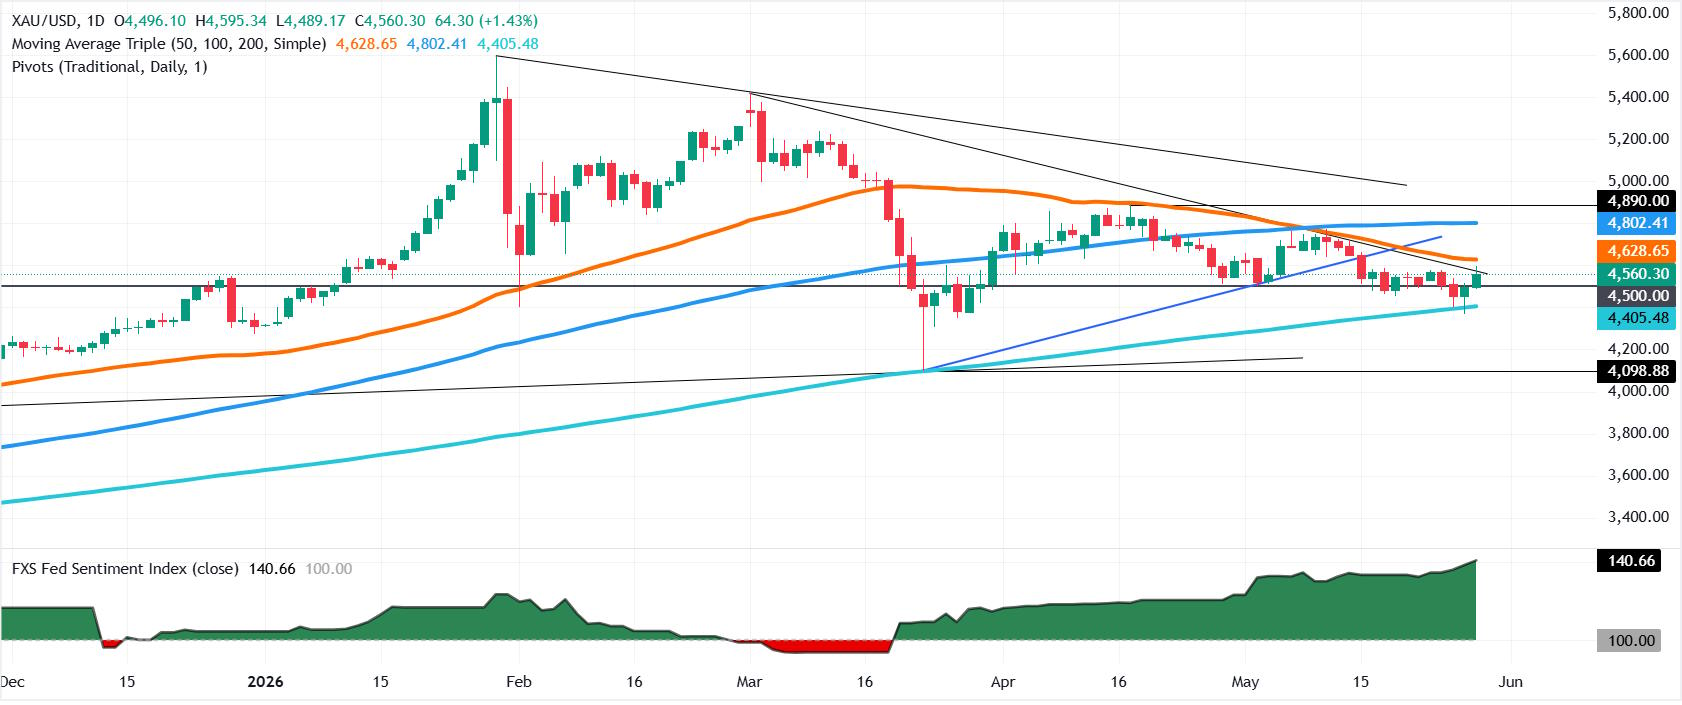
XAU/USD technical analysis: Gold price clears $4,500, eyes on 20-day SMA
Gold price clearly reclaimed the $4,500 level and the downward resistance trendline, opening the door to challenge key resistance levels.
Buyers are gaining momentum, as the Relative Strength Index (RSI), although bearish, is rising, a signal of further upside.
The 20-day Simple Moving Average (SMA) serves as the first level of resistance at $4,588, followed by $4,600. Above this lies the 50-day SMA at $4,630, followed by the 100-day SMA at $4,798.
Downwards, if XAU/USD dives below $4,500, the first support would be $4,450, opening the door to the 200-day SMA at $4,399, followed by the intraday low at $4,366.
Gold FAQs
Gold has played a key role in human’s history as it has been widely used as a store of value and medium of exchange. Currently, apart from its shine and usage for jewelry, the precious metal is widely seen as a safe-haven asset, meaning that it is considered a good investment during turbulent times. Gold is also widely seen as a hedge against inflation and against depreciating currencies as it doesn’t rely on any specific issuer or government.
Central banks are the biggest Gold holders. In their aim to support their currencies in turbulent times, central banks tend to diversify their reserves and buy Gold to improve the perceived strength of the economy and the currency. High Gold reserves can be a source of trust for a country’s solvency. Central banks added 1,136 tonnes of Gold worth around $70 billion to their reserves in 2022, according to data from the World Gold Council. This is the highest yearly purchase since records began. Central banks from emerging economies such as China, India and Turkey are quickly increasing their Gold reserves.
Gold has an inverse correlation with the US Dollar and US Treasuries, which are both major reserve and safe-haven assets. When the Dollar depreciates, Gold tends to rise, enabling investors and central banks to diversify their assets in turbulent times. Gold is also inversely correlated with risk assets. A rally in the stock market tends to weaken Gold price, while sell-offs in riskier markets tend to favor the precious metal.
The price can move due to a wide range of factors. Geopolitical instability or fears of a deep recession can quickly make Gold price escalate due to its safe-haven status. As a yield-less asset, Gold tends to rise with lower interest rates, while higher cost of money usually weighs down on the yellow metal. Still, most moves depend on how the US Dollar (USD) behaves as the asset is priced in dollars (XAU/USD). A strong Dollar tends to keep the price of Gold controlled, whereas a weaker Dollar is likely to push Gold prices up.













