
Gold Price Forecast: Spot Gold pushes back above $5,000
작성자 Joshua Gibson
게시일: 10 Feb 2026 | 수정일: 10 Feb 2026


인기 기사

The daily chart shows spot Gold in a parabolic uptrend that accelerated sharply from the $4,600 area in late January, printing a record high at $5,598.25 before a violent reversal erased nearly $1,000 in value during the final days of the month.
- Spot Gold prices are back on the high side of $5,000 after a fresh bullish push on Monday.
- Despite a sharp recovery, XAU/USD remains steeply off of record highs posted in January.
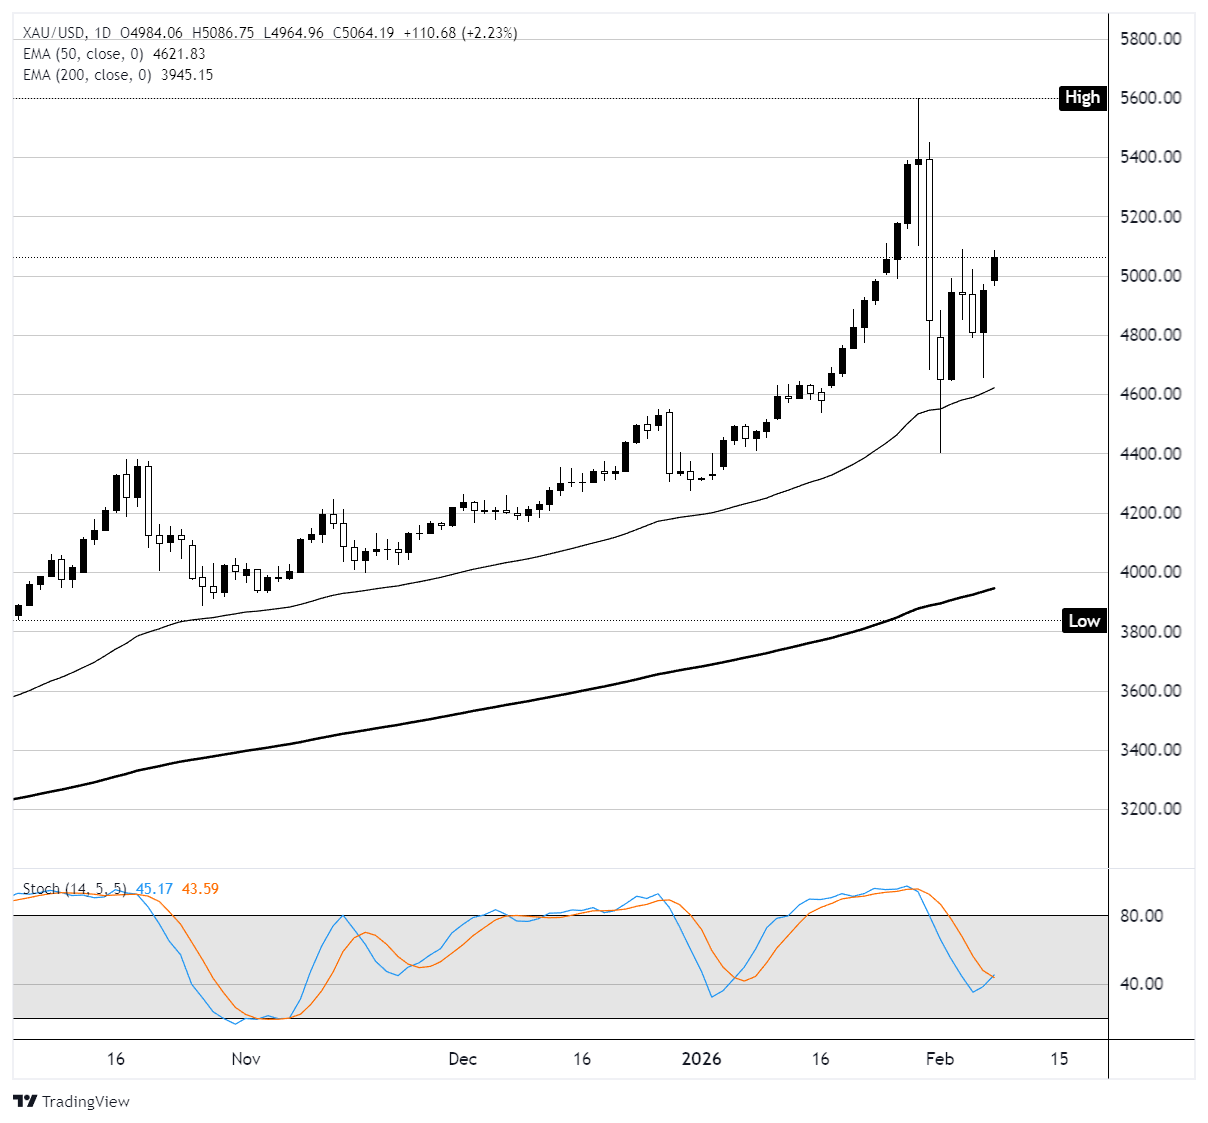
The daily chart shows spot Gold in a parabolic uptrend that accelerated sharply from the $4,600 area in late January, printing a record high at $5,598.25 before a violent reversal erased nearly $1,000 in value during the final days of the month. That sell-off, driven by a wave of margin liquidations and a spillover from the silver market, found a floor near the 50 Exponential Moving Average (EMA) at $4,621.62 before buyers stepped back in aggressively. The 200 EMA sits far below at $3,945.10, underscoring the sheer distance Gold has traveled from its long-term mean. Monday's session opened at $4,984.06 and rallied +2.13% to close at $5,058.98, with the day's high reaching $5,086.75 and the low printing $4,964.96. The bullish daily candle reclaimed the $5,000 psychological level convincingly, a key threshold the market lost during last week's volatility.
The broader forces pushing Gold higher remain firmly in place: the People's Bank of China (PBoC) extended its buying streak to a 15th consecutive month in January; the Federal Reserve (Fed) is holding rates at 3.50% to 3.75% with markets pricing further cuts later this year amid a softening US labor market (December payrolls came in at just 50K); and Wells Fargo raised its year-end target to $6,100 to $6,300 on February 4, joining JPMorgan at $6,300 and UBS at $6,200 in signaling further upside. US Dollar weakness, concerns about Fed independence following the Kevin Warsh nomination, and ongoing US-Iran geopolitical tensions are adding to the safe-haven bid.
The Stochastic Oscillator (14, 5, 5) on the daily chart reads 45.09/43.57, sitting near the midline after bouncing sharply off the oversold zone during last week's sell-off. This neutral positioning gives the oscillator room to turn higher without the overbought conditions that preceded the January 29 blow-off top. Monday's price action formed a strong bullish candle body with small wicks on both sides, suggesting genuine buying conviction rather than short-covering. Immediate resistance sits at $5,100, followed by the $5,200 area where sellers capped rallies in late January before the final spike to the all-time high. A sustained move above $5,200 would open the path toward $5,400, the prior swing high zone. On the downside, the $5,000 round number now serves as first support, with stronger demand expected in the $4,800 area where price consolidated briefly during the recent correction.
A break below $4,800 would expose the 50 EMA near $4,620 as the next structural floor. With central bank accumulation providing a durable bid, a weakening US Dollar, and institutional price targets clustering above $6,000, the technical recovery from the late-January liquidation flush appears to have legs, though Wednesday's release of the delayed US Nonfarm Payrolls (NFP) report for January could inject fresh volatility depending on whether inflation continues to run above the Fed's 2% target.
XAU/USD daily chart
Gold FAQs
Gold has played a key role in human’s history as it has been widely used as a store of value and medium of exchange. Currently, apart from its shine and usage for jewelry, the precious metal is widely seen as a safe-haven asset, meaning that it is considered a good investment during turbulent times. Gold is also widely seen as a hedge against inflation and against depreciating currencies as it doesn’t rely on any specific issuer or government.
Central banks are the biggest Gold holders. In their aim to support their currencies in turbulent times, central banks tend to diversify their reserves and buy Gold to improve the perceived strength of the economy and the currency. High Gold reserves can be a source of trust for a country’s solvency. Central banks added 1,136 tonnes of Gold worth around $70 billion to their reserves in 2022, according to data from the World Gold Council. This is the highest yearly purchase since records began. Central banks from emerging economies such as China, India and Turkey are quickly increasing their Gold reserves.
Gold has an inverse correlation with the US Dollar and US Treasuries, which are both major reserve and safe-haven assets. When the Dollar depreciates, Gold tends to rise, enabling investors and central banks to diversify their assets in turbulent times. Gold is also inversely correlated with risk assets. A rally in the stock market tends to weaken Gold price, while sell-offs in riskier markets tend to favor the precious metal.
The price can move due to a wide range of factors. Geopolitical instability or fears of a deep recession can quickly make Gold price escalate due to its safe-haven status. As a yield-less asset, Gold tends to rise with lower interest rates, while higher cost of money usually weighs down on the yellow metal. Still, most moves depend on how the US Dollar (USD) behaves as the asset is priced in dollars (XAU/USD). A strong Dollar tends to keep the price of Gold controlled, whereas a weaker Dollar is likely to push Gold prices up.

100만 명이 넘는 사용자가 FXStreet를 통해 실시간 시장 데이터, 차트 도구, 전문가 인사이트, 포렉스 뉴스를 이용합니다. 포괄적인 경제 캘린더와 교육 웨비나는 트레이더가 정보를 유지하고 신중한 결정을 내리도록 돕습니다. FXStreet는 바르셀로나 본사와 전 세계 지역에 걸쳐 약 60명의 팀으로 구성되어 있습니다.
더 읽기


