
Gold Price Forecast: XAU/USD’s recovery might extend to the $5,000 area
작성자 Guillermo Alcala
수정됨: 30 Mar 2026


인기 기사

Gold (XAU/USD) reversal from early March highs at $5,420 seems to have found support at $4,100 last week, and the pair has been showing a moderate positive tone over the last few days.
- Gold edges higher beyond $4,500 with technical indicators turning bullish.
- The US Dollar Index remains firm but is nearing a key resistance area.
- Above the Fibonacci retracement at $4,610, bulls might target the key $5,000 area.
Gold (XAU/USD) reversal from early March highs at $5,420 seems to have found support at $4,100 last week, and the pair has been showing a moderate positive tone over the last few days.
The US Dollar Index maintains a strong trend, favoured by higher US Treasury yields amid rising hopes that the US Federal Reserve (Fed) will be forced to change course and hike interest rates at least once this year. The DXY, however, is nearing a key resistance area at 100.50. If bulls fail again at that level, we might see a deeper correction in Gold.
Technical Analysis
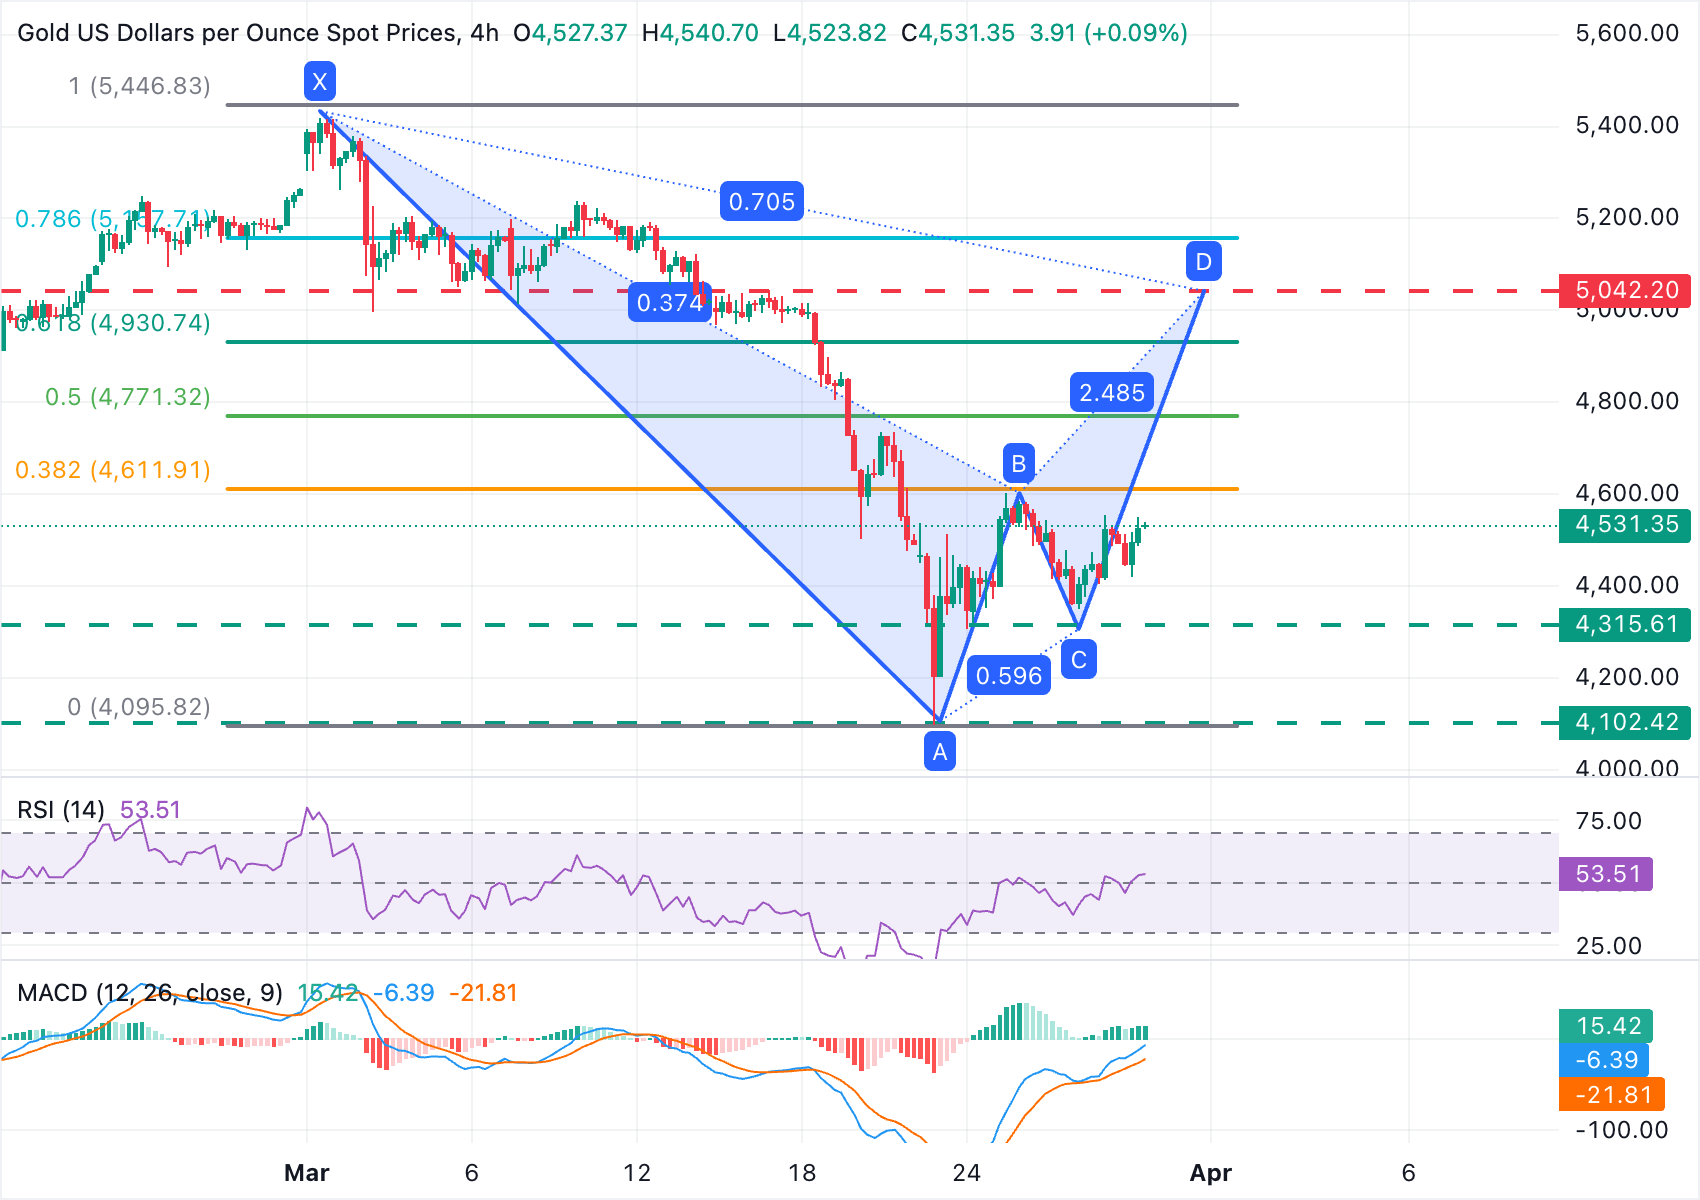
The 4-hour chart shows XAU/USD trading at $4,532. The near-term bias is mildly bullish as price rebounds from last week’s lows, with technical indicators coming up from heavily oversold levels, and the higher low suggesting that the bearish trend has lost steam.
The Relative Strength Index (RSI) has climbed to 53.58, edging above the 50 midline and suggesting improving upside momentum. The Moving Average Convergence Divergence (MACD) line stands above the Signal line in positive territory with a modestly positive histogram, which reinforces a moderate bullish momentum.
Price action suggests that we are in a C-D leg of a Gartley pattern, with immediate resistance at the 38.2% Fobonacci retracement of the March sell-off, around $4,610. A confirmation above here would expose the March 20 low at the $4,750 area, although the most plausible target for a bullish correction is the $5,040 area, a previous support-turned-resistance on March 16 and 17.
On the downside, initial support is at Friday's low of $4,315 ahead of the mentioned March 23 low at the $4,100 area.
(The technical analysis of this story was written with the help of an AI tool.)
Gold FAQs
Gold has played a key role in human’s history as it has been widely used as a store of value and medium of exchange. Currently, apart from its shine and usage for jewelry, the precious metal is widely seen as a safe-haven asset, meaning that it is considered a good investment during turbulent times. Gold is also widely seen as a hedge against inflation and against depreciating currencies as it doesn’t rely on any specific issuer or government.
Central banks are the biggest Gold holders. In their aim to support their currencies in turbulent times, central banks tend to diversify their reserves and buy Gold to improve the perceived strength of the economy and the currency. High Gold reserves can be a source of trust for a country’s solvency. Central banks added 1,136 tonnes of Gold worth around $70 billion to their reserves in 2022, according to data from the World Gold Council. This is the highest yearly purchase since records began. Central banks from emerging economies such as China, India and Turkey are quickly increasing their Gold reserves.
Gold has an inverse correlation with the US Dollar and US Treasuries, which are both major reserve and safe-haven assets. When the Dollar depreciates, Gold tends to rise, enabling investors and central banks to diversify their assets in turbulent times. Gold is also inversely correlated with risk assets. A rally in the stock market tends to weaken Gold price, while sell-offs in riskier markets tend to favor the precious metal.
The price can move due to a wide range of factors. Geopolitical instability or fears of a deep recession can quickly make Gold price escalate due to its safe-haven status. As a yield-less asset, Gold tends to rise with lower interest rates, while higher cost of money usually weighs down on the yellow metal. Still, most moves depend on how the US Dollar (USD) behaves as the asset is priced in dollars (XAU/USD). A strong Dollar tends to keep the price of Gold controlled, whereas a weaker Dollar is likely to push Gold prices up.

100만 명이 넘는 사용자가 FXStreet를 통해 실시간 시장 데이터, 차트 도구, 전문가 인사이트, 포렉스 뉴스를 이용합니다. 포괄적인 경제 캘린더와 교육 웨비나는 트레이더가 정보를 유지하고 신중한 결정을 내리도록 돕습니다. FXStreet는 바르셀로나 본사와 전 세계 지역에 걸쳐 약 60명의 팀으로 구성되어 있습니다.
더 읽기


