
Hedera Price Forecast: HBAR stalls as derivatives data signals limited recovery
작성자 Manish Chhetri
게시일: 17 Feb 2026 | 수정일: 17 Feb 2026


인기 기사

Hedera (HBAR) is trading below $0.101 at the time of writing on Tuesday after failing to break through a key resistance zone over the weekend. The derivatives data show a limited recovery potential in HBAR as Open Interest (OI) is falling steadily alongside negative funding rates, while the technic
- Hedera price trades lower after failing to close above a key resistance zone.
- Derivatives data suggest limited recovery, with HBAR’s open interest at very low levels alongside negative funding rates.
- The technical outlook suggests the correction could extend to $0.090.
Hedera (HBAR) is trading below $0.101 at the time of writing on Tuesday after failing to break through a key resistance zone over the weekend. The derivatives data show a limited recovery potential in HBAR as Open Interest (OI) is falling steadily alongside negative funding rates, while the technical outlook is unfavorable.
Hedera’s derivatives data shows bearish bias
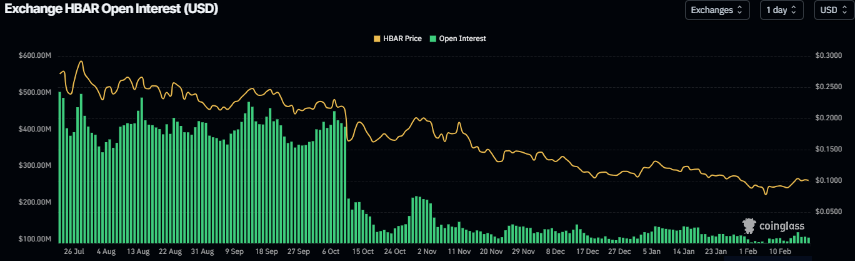
Hedera’s futures OI falls to $104.58 million on Tuesday, having been steadily declining since early January and nearing the February 6 level of $88.89 million. This drop in OI reflects waning investor participation and projects a bearish outlook.
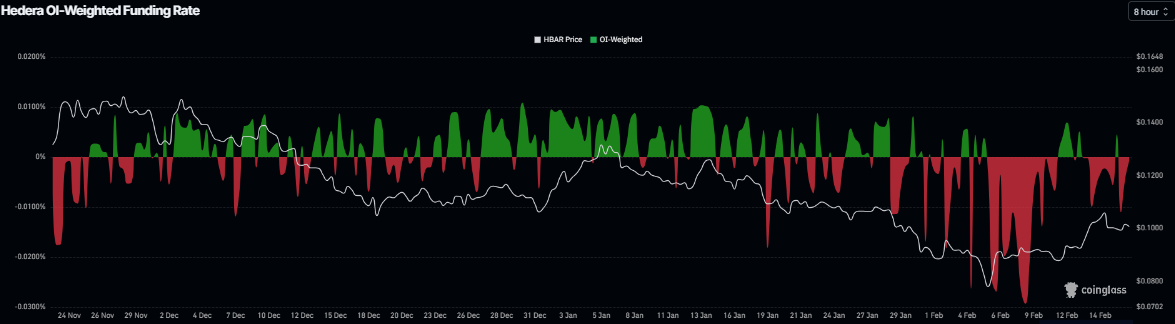
In addition, Coinglass’s OI-Weighted Funding Rate data shows that the number of traders betting that the price of Hedera will slide further is higher than those anticipating a price increase. The metric turned negative on Monday and stands at -0.011% on Tuesday. The negative ratio suggests that shorts are paying longs, suggesting bearish sentiment toward HBAR.
Hedera Price Forecast: Faces rejection from a key resistance zone
Hedera’s price was rejected around the 50-day Exponential Moving Average (EMA) at $0.105 on Saturday and declined slightly the next day. This 50-day EMA level roughly coincides with the upper trendline of a falling wedge pattern (drawn by connecting multiple highs and lows from the end of June), making it a key resistance zone. As of writing on Tuesday, HBAR is trading at $0.010.
If HBAR continues its correction, it could extend the decline toward the weekly support at $0.090. A close below this level could extend the losses toward the next daily support level at $0.072, which aligns with the October 10 low.
The Relative Strength Index (RSI) on a daily chart is at 51, pointing downward toward the neutral 50 level, indicating fading bullish momentum. For the bearish momentum to be sustained, the RSI must move below the neutral level. However, the Moving Average Convergence Divergence (MACD) showed a bullish crossover on February 10, which remains in place, suggesting that upside bias has not been invalidated yet.
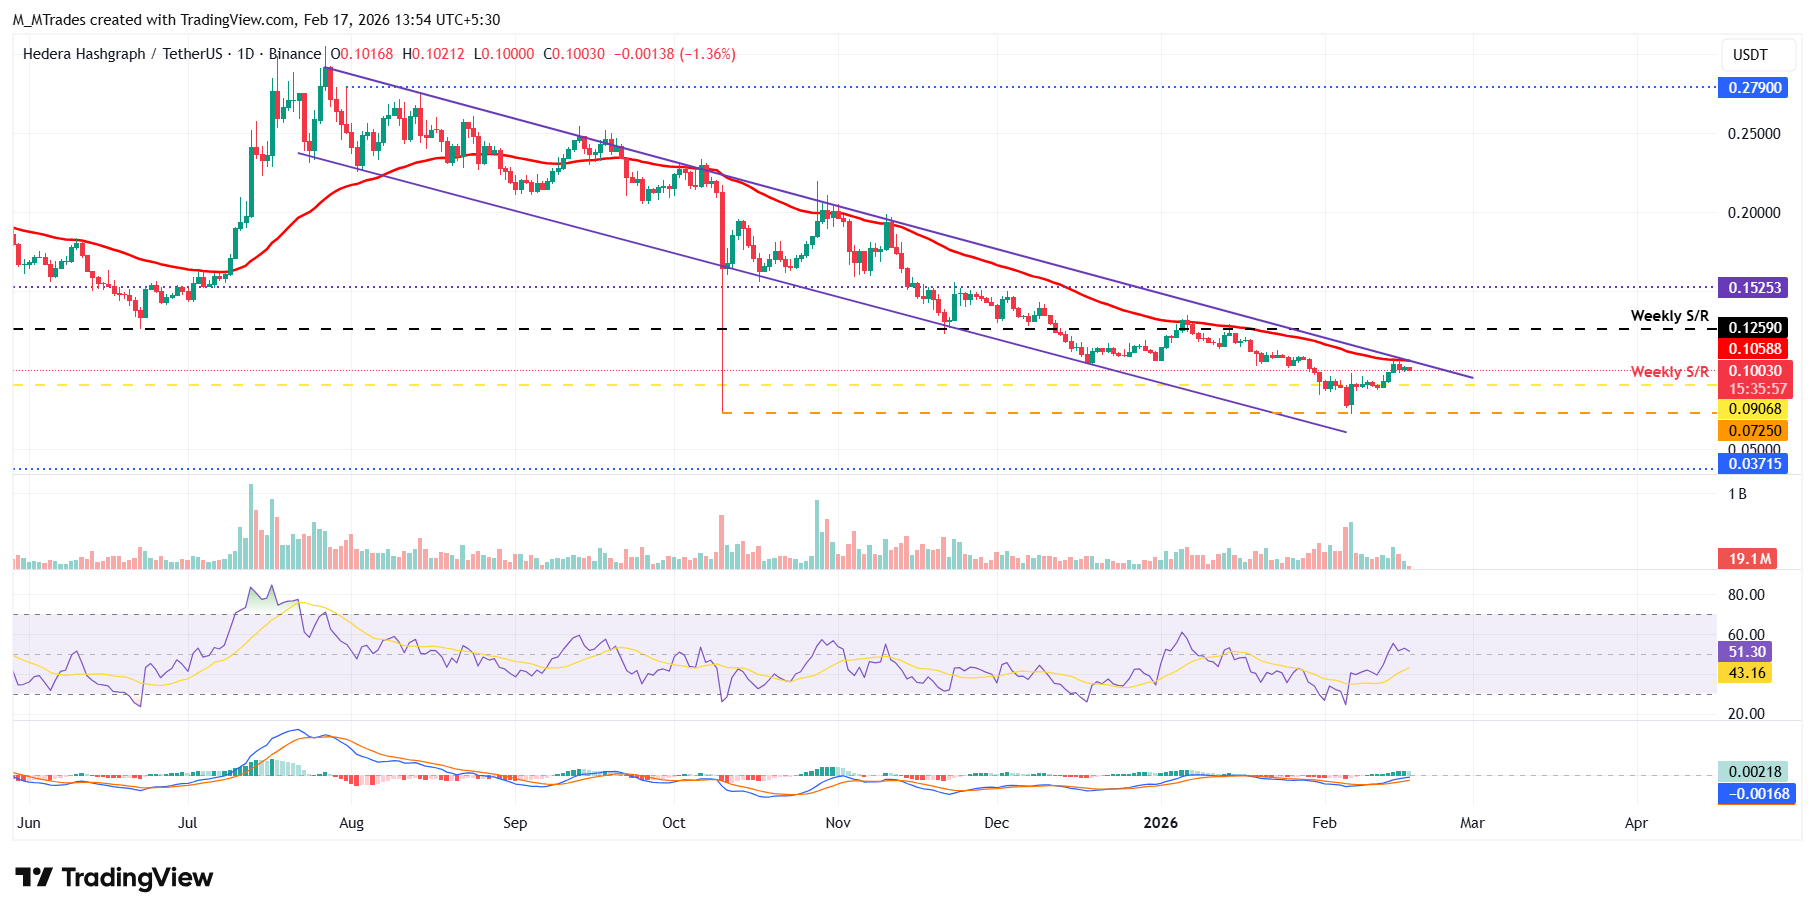
On the other side, if HBAR recovers and closes above the 50-day EMA at $0.105, it could extend the advance toward the next weekly resistance at $0.125.

100만 명이 넘는 사용자가 FXStreet를 통해 실시간 시장 데이터, 차트 도구, 전문가 인사이트, 포렉스 뉴스를 이용합니다. 포괄적인 경제 캘린더와 교육 웨비나는 트레이더가 정보를 유지하고 신중한 결정을 내리도록 돕습니다. FXStreet는 바르셀로나 본사와 전 세계 지역에 걸쳐 약 60명의 팀으로 구성되어 있습니다.
더 읽기


