
Hyperliquid Price Forecast: HYPE consolidates as traders show mixed sentiment
작성자 Manish Chhetri
게시일: 10 Feb 2026 | 수정일: 10 Feb 2026


인기 기사

Hyperliquid (HYPE) price is trading sideways at the time of writing on Tuesday, reflecting market indecision as traders await a clearer directional signal. The derivatives data further supports this mixed sentiment, with rising short bets while funding rates remain positive.
- Hyperliquid price trades sideways, holding within the $30.78-$36.51 range.
- Mixed sentiment among traders with rising short bets while funding rates stay positive.
- The technical outlook suggests a wait-and-see approach to the next directional move.
Hyperliquid (HYPE) price is trading sideways at the time of writing on Tuesday, reflecting market indecision as traders await a clearer directional signal. The derivatives data further supports this mixed sentiment, with rising short bets while funding rates remain positive.
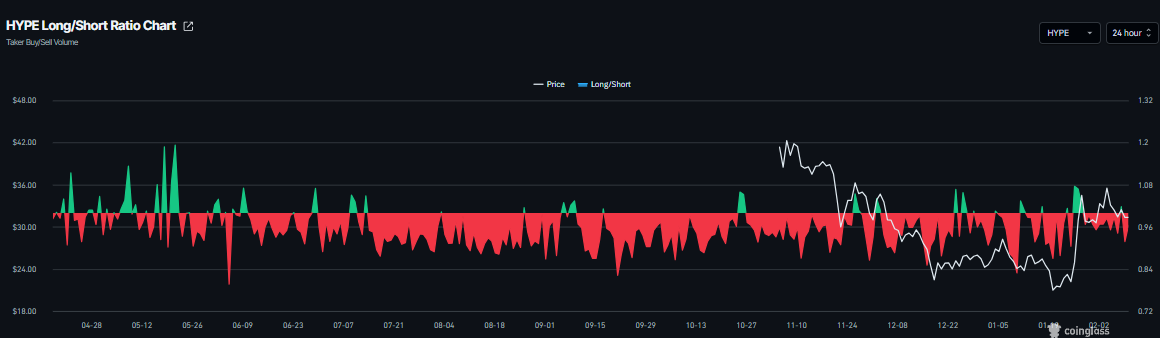
Mixed signals among HYPE traders
Hyperliquid’s derivatives data shows mixed signals. CoinGlass long-to-short ratio for HYPE reads 0.91 on Tuesday. This ratio, being below one, reflects bearish sentiment in the market, as more traders are betting on the asset's price to fall.
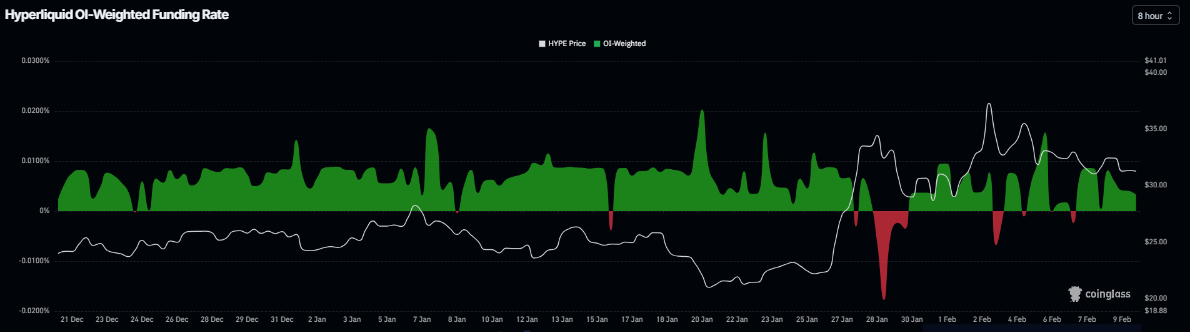
Meanwhile, the funding rates support a bullish thesis. CoinGlass’s OI-Weighted Funding Rate data shows that the number of traders betting that the price of HYPE will slide further is lower than those anticipating a price increase.
The metric flipped to a positive rate on Saturday and currently stands at 0.0033% on Tuesday, indicating that longs are paying shorts. Historically, as shown in the chart below, when the funding rates have flipped from negative to positive, Hyperliquid’s price has rallied sharply.
Hyperliquid Price Forecast: Wait-and-see approach for the next direction move
Hyperliquid price has been trading sideways between the 100-day Exponential Moving Average (EMA) at $30.77 and the daily resistance at $36.51 since January 28. At the time of writing on Tuesday, HYPE is nearing the lower consolidating boundary at $30.77.
Traders looking to short HYPE could do so if it breaks and closes below the 100-day EMA at $30.77 on a daily basis; this could extend the decline toward weekly support at $26.85.
The Relative Strength Index (RSI) on the daily chart is 53, pointing downward toward the neutral 50 level, indicating fading bullish momentum. The Moving Average Convergence Divergence (MACD) is showing a bearish crossover on Tuesday, suggesting early signs of bearish momentum.
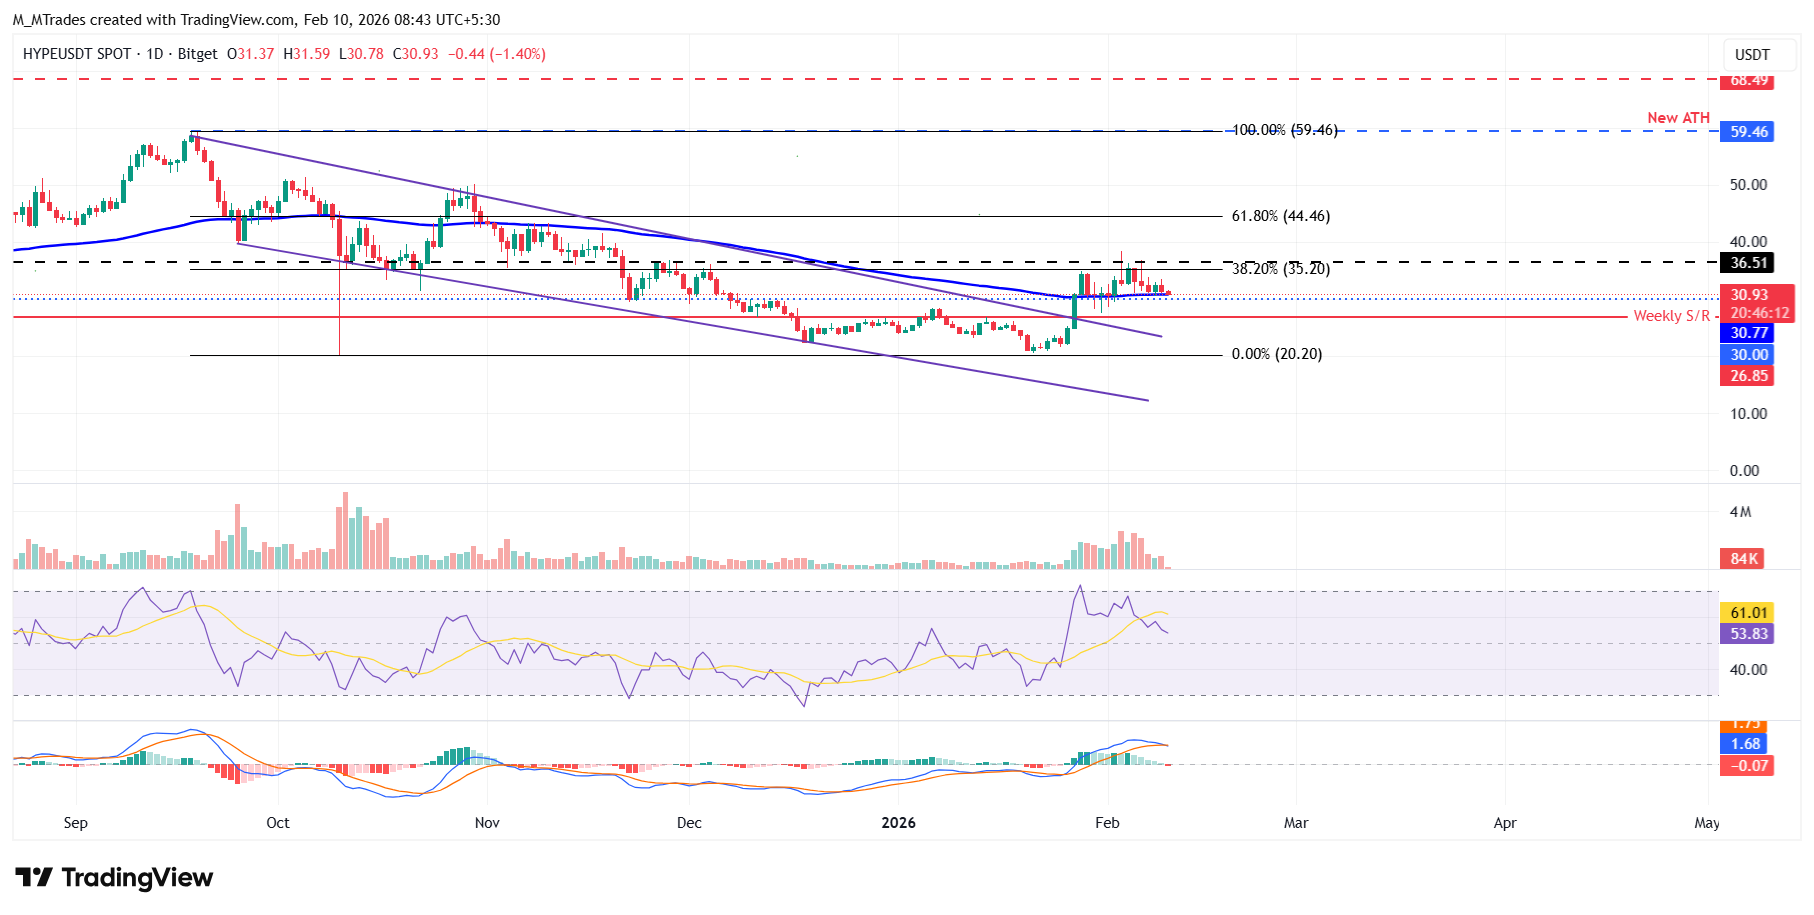
However, if HYPE breaks and closes above the upper consolidation range at $36.51 on a daily basis, it could extend the rally toward the 61.8% Fibonacci retracement level at $44.46.

100만 명이 넘는 사용자가 FXStreet를 통해 실시간 시장 데이터, 차트 도구, 전문가 인사이트, 포렉스 뉴스를 이용합니다. 포괄적인 경제 캘린더와 교육 웨비나는 트레이더가 정보를 유지하고 신중한 결정을 내리도록 돕습니다. FXStreet는 바르셀로나 본사와 전 세계 지역에 걸쳐 약 60명의 팀으로 구성되어 있습니다.
더 읽기


