

Hyperliquid Price Forecast: HYPE extends losses as demand dips amid fresh US-Iran strikes
- Hyperliquid is down over 2% on Monday, testing a bearish breakout of a crucial support trendline.
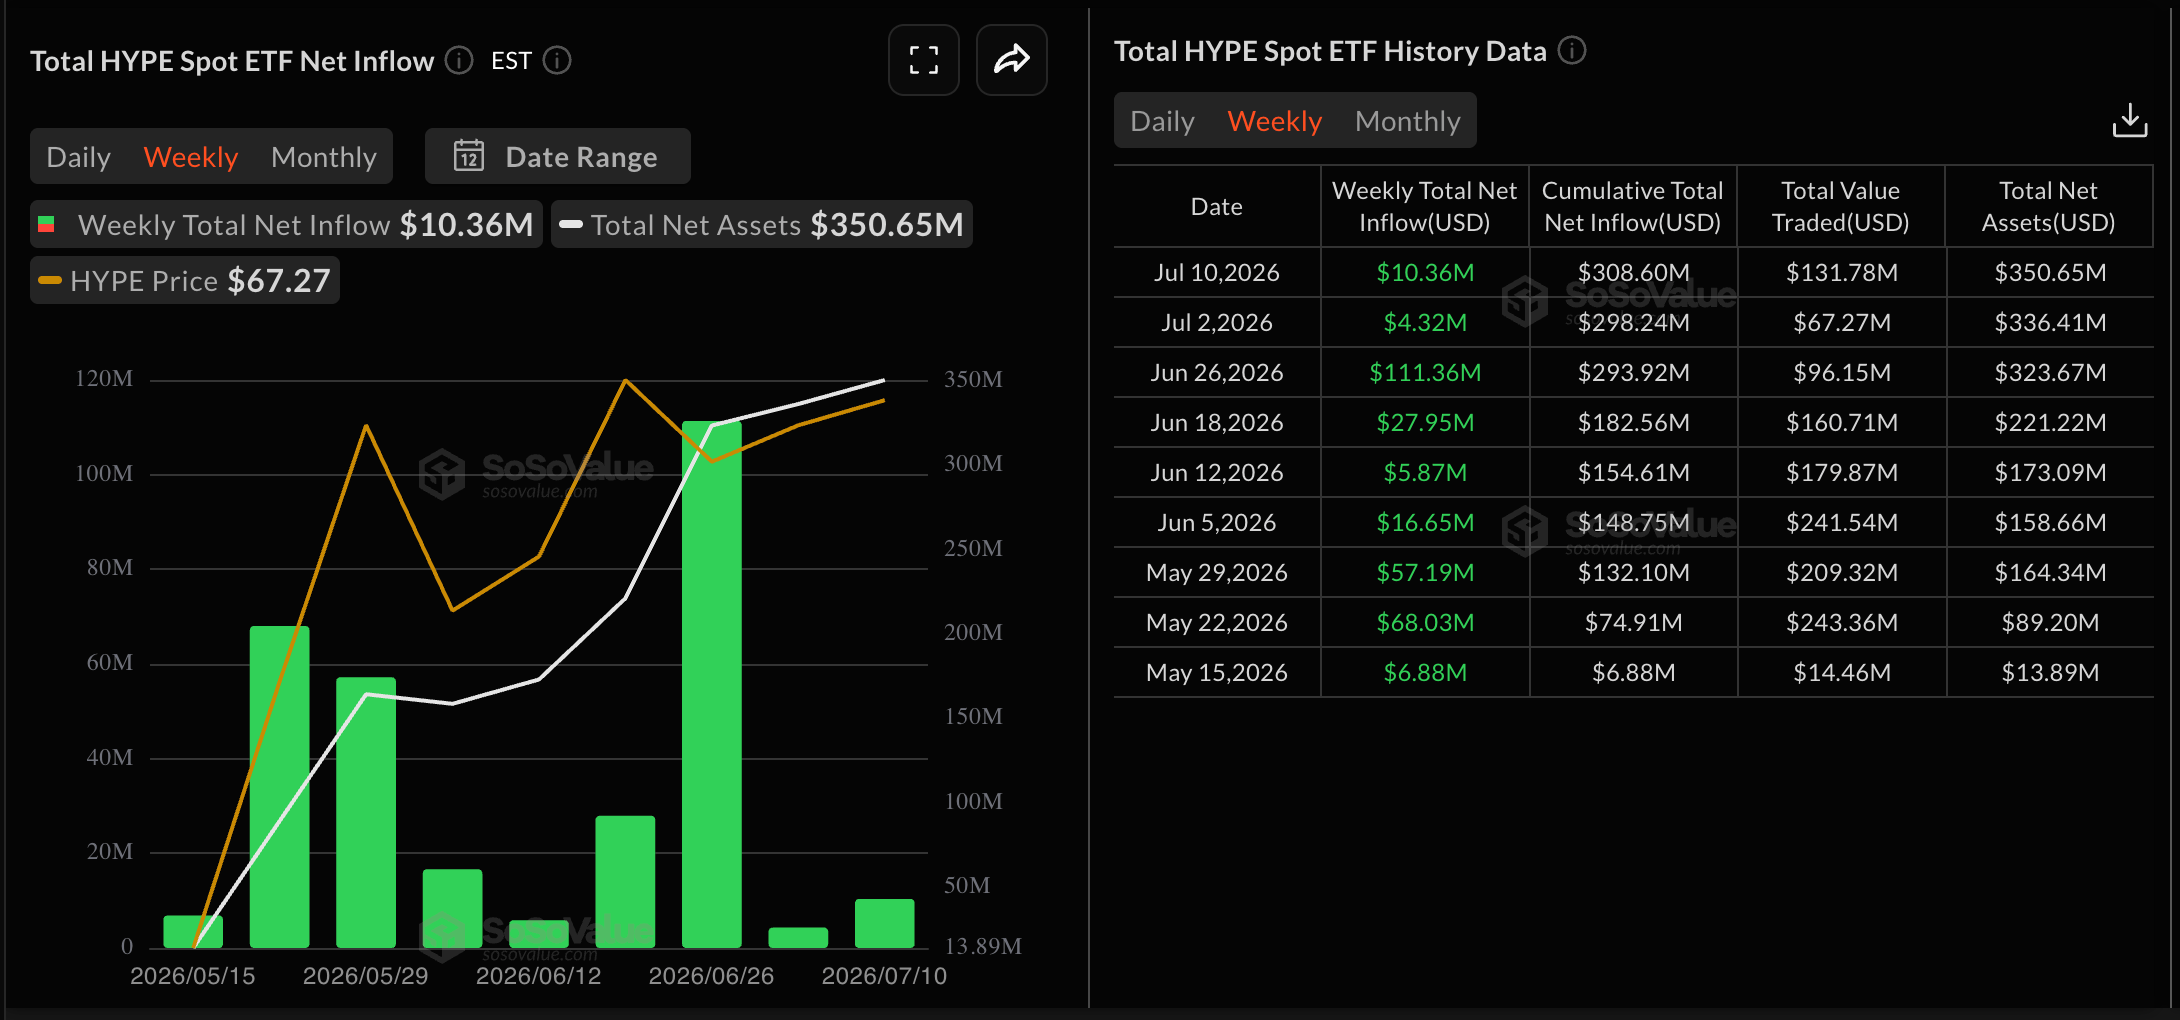
- HYPE ETFs recorded around $10 million in inflows last week, reflecting steady institutional demand.
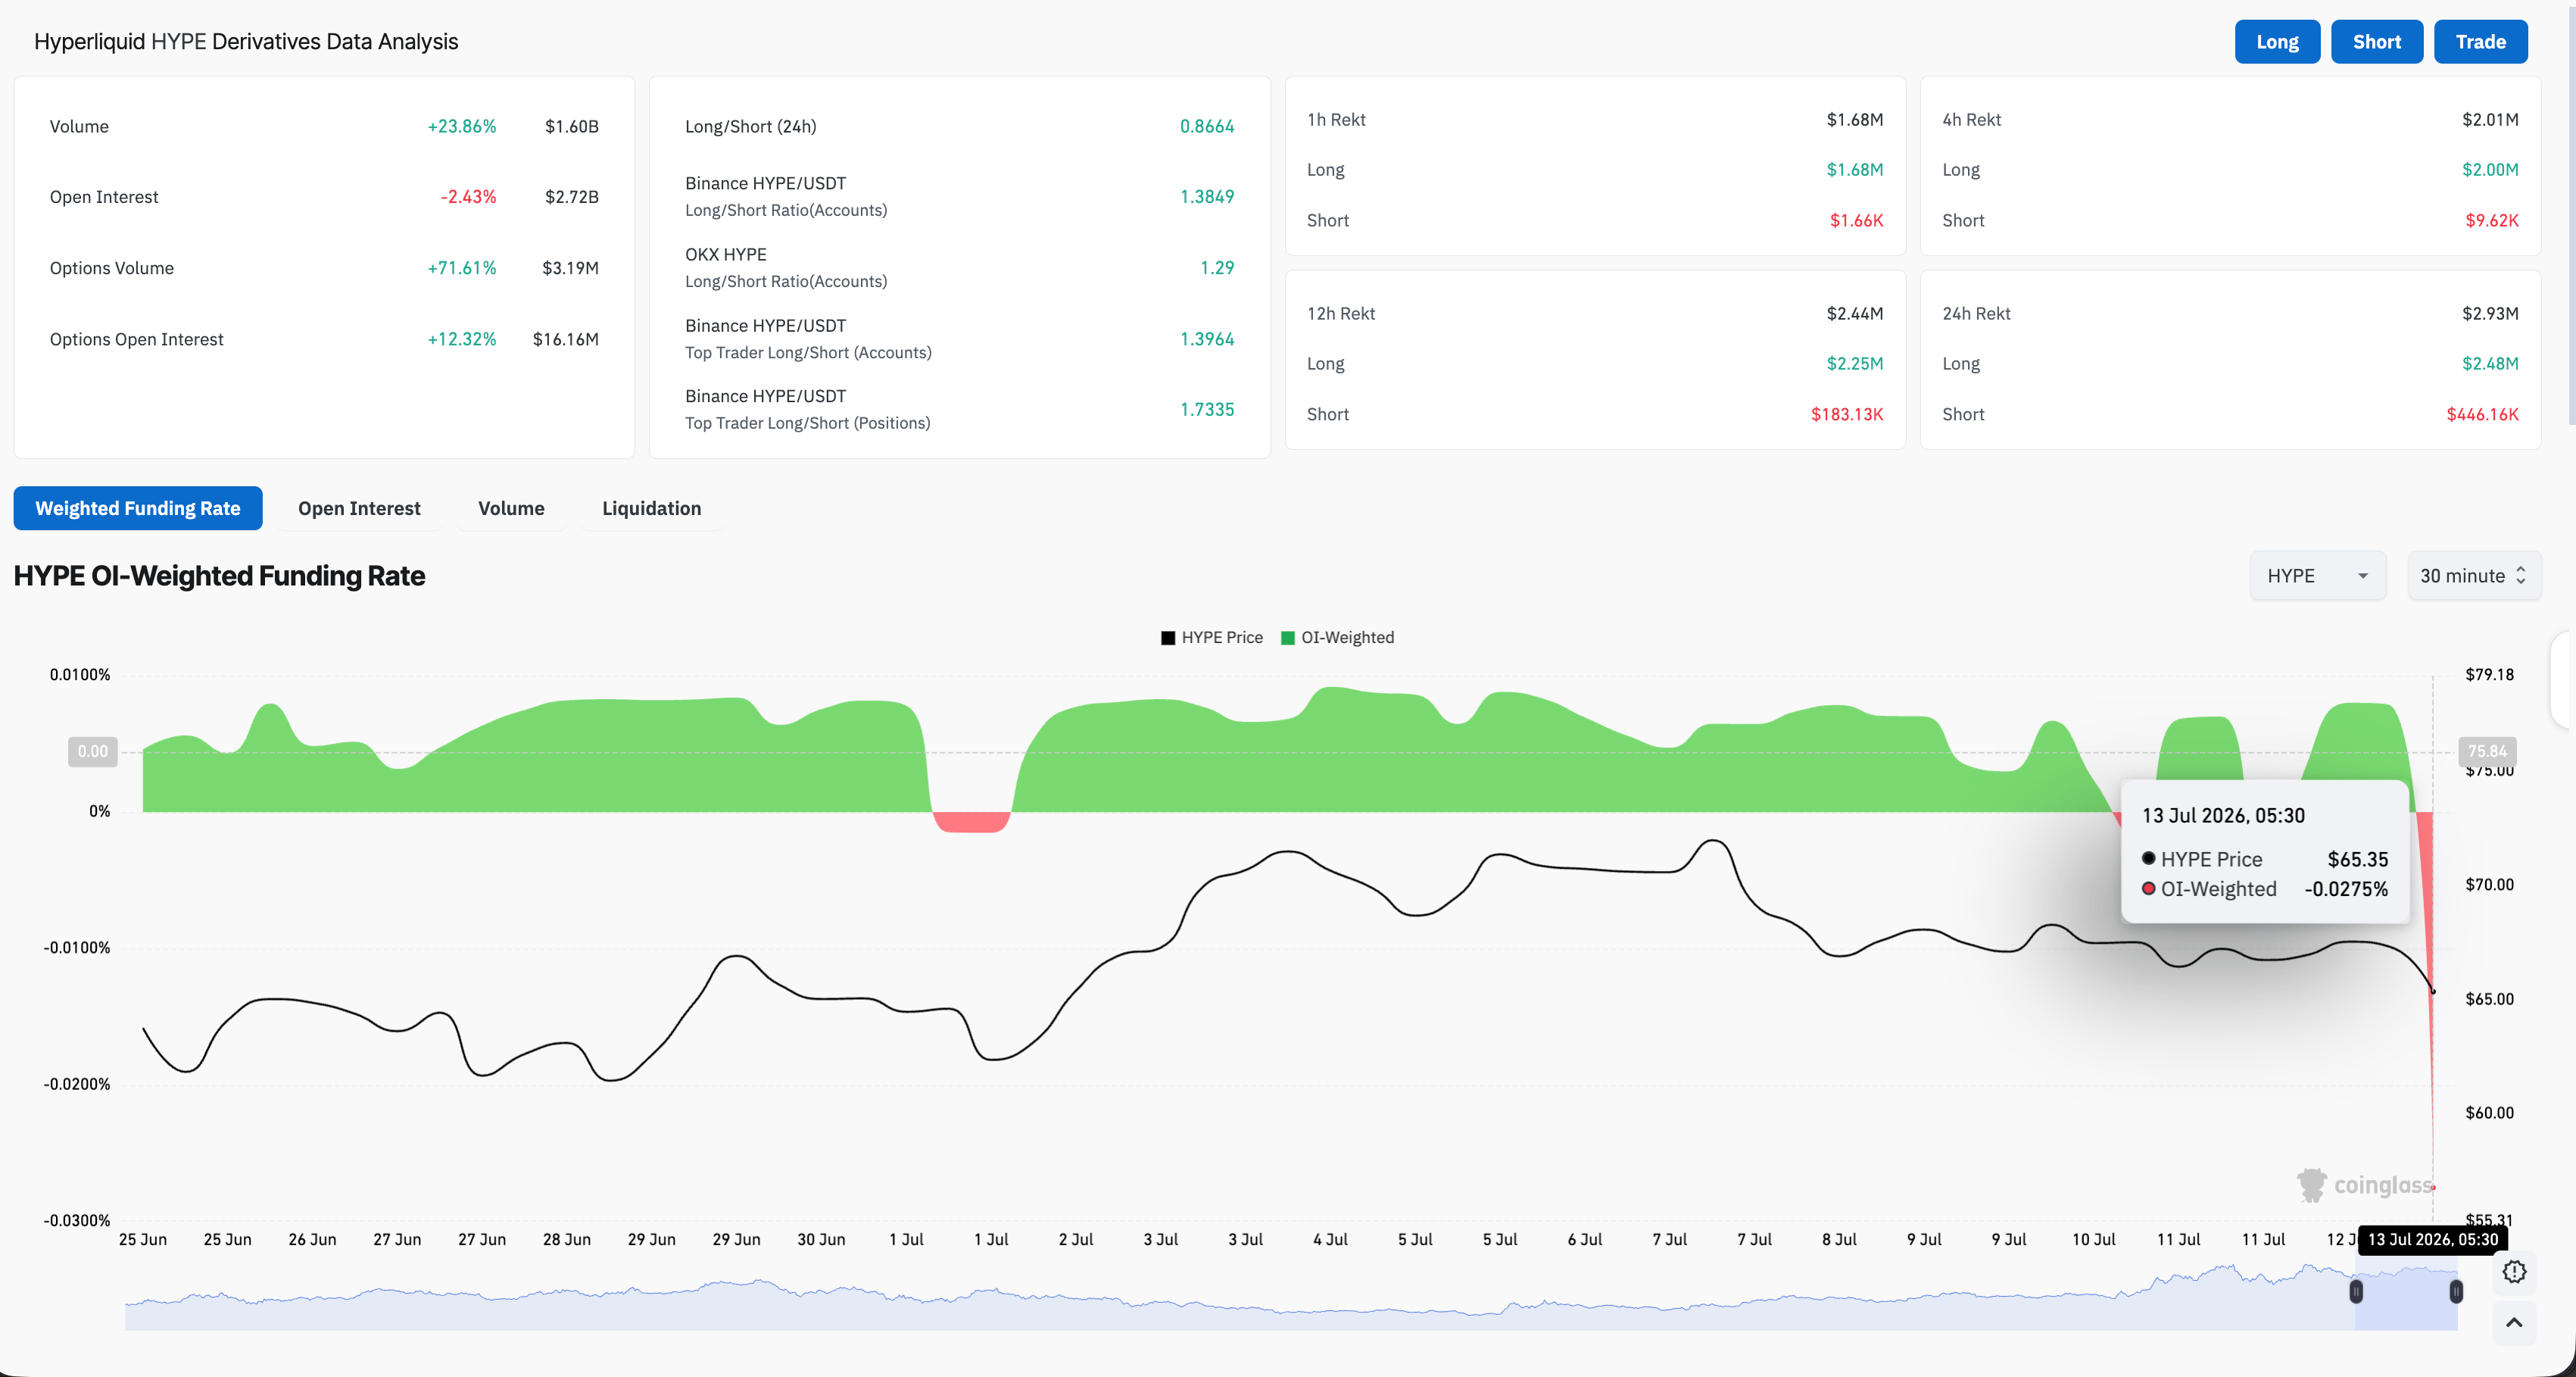
- Broader market correction weighs down on retail demand for HYPE, as Open Interest wanes amid a sharp decline in the funding rate.
Hyperliquid (HYPE) is down over 2% on Monday, extending last week's decline despite steady weekly institutional inflows of around $10 million. HYPE futures signal reduced retail support as the Open Interest and funding rates take a sharp drop. Technically, a clear breakout of the ascending trendline could threaten the supporting 50-day Exponential Moving Average (EMA) around $63.13.

Broader market weakness weighs down on HYPE
Renewed strikes between the US and Iran over the passage of oil tankers through the Strait of Hormuz have elevated broader market risk-off sentiment. Demand in the crypto market has eased, with altcoins such as Hyperliquid trading in the red.
CoinGlass data shows the HYPE futures Open Interest is down over 2% in the last 24 hours to $2.72 billion, reflecting a contraction in active leveraged positions. In addition, the total liquidation of $2.93 million, led by $2.48 million in long liquidations, aligns with a reduced risk appetite, mainly from long-position buyers.
At the same time, the funding rate has plunged to 0.0275%, reflecting a sharp shift among traders toward buying short positions at a premium.
However, HYPE-focused Exchange Traded Funds (ETFs) recorded $10.36 million in inflows last week, indicating steady demand from institutional investors. Taken together, the derivatives market signals short-term downside risk in HYPE while the ninth consecutive week of institutional inflows supports long-term upside.
Technical outlook: Will HYPE hold above its 50-day EMA?
Hyperliquid trades around $65 at press time on Monday, testing the breakout of a crucial support trendline around $68.50. The path of least resistance guides HYPE toward the 50-day EMA at $63.13, which acts as the immediate support zone. A decisive daily close below $63.13 could extend the decline toward the 50% retracement level at $53.71, measured from the $38.17 to $75.58.
In addition, the momentum is softening on the daily chart, with the Relative Strength Index (RSI) at 48 slipping below the midline. At the same time, the Moving Average Convergence Divergence (MACD) descends below the signal line as the negative histogram expands. Together, the indicators suggest that momentum is shifting neutral to bearish.
On the topside, a potential rebound could retest the overhead barrier around the previous swing high at $75.58.
(The technical analysis of this story was written with the help of an AI tool. Know more.)














