
Hyperliquid Price Forecast: HYPE price correction deepens amid bearish market indicators
작성자 Manish Chhetri
게시일: 23 Feb 2026 | 수정일: 23 Feb 2026


인기 기사

Hyperliquid (HYPE) declines nearly 5%, trading below $28 at the time of writing on Monday, extending losses for the third consecutive week since early February. The bearish sentiment further strengthens with falling Open Interest (OI), rising short bets and negative funding rates.
- Hyperliquid price corrects 5% on Monday, extending losses for the third consecutive week.
- Open Interest continues to decline while short positions reach their highest level in over a month, alongside negative funding rates, hinting at bearish sentiment.
- Momentum indicators suggest further downside risk, signaling the correction may not be over yet.
Hyperliquid (HYPE) declines nearly 5%, trading below $28 at the time of writing on Monday, extending losses for the third consecutive week since early February. The bearish sentiment further strengthens with falling Open Interest (OI), rising short bets and negative funding rates. Meanwhile, the momentum indicators suggest risk of a deeper correction, with sellers remaining firmly in control.
Hyperliquid’s derivatives data shows fading traders’ sentiment
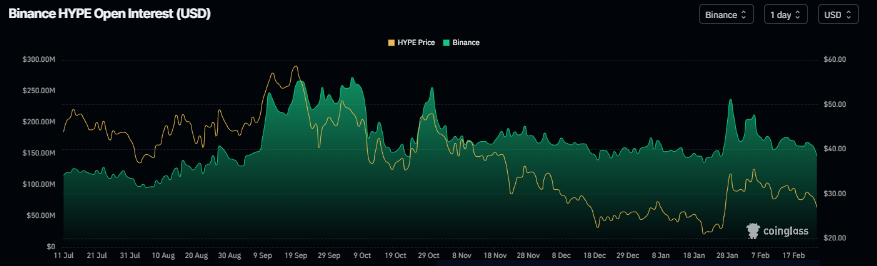
Hyperliquid futures Open Interest (OI) at Binance exchange falls to $146.15 million on Monday, having been steadily declining since the end of January and nearing the January 21 level of $135 million. This drop in OI reflects waning investor participation and projects a bearish outlook.
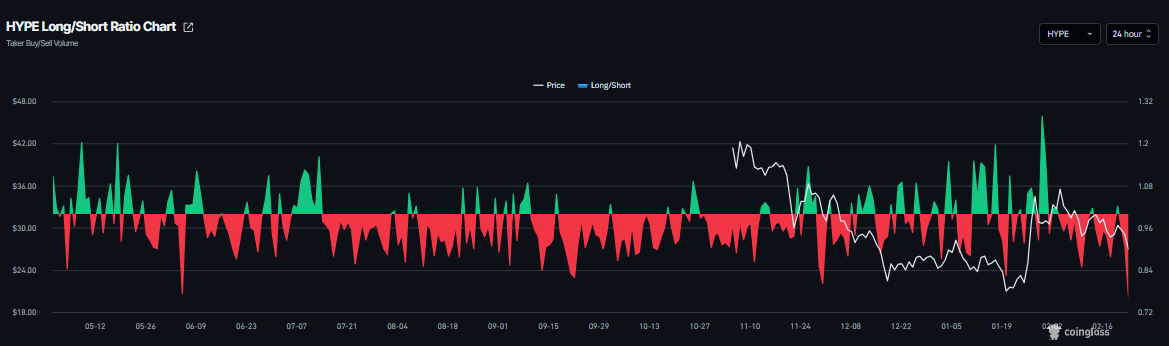
CoinGlass’s long-to-short ratio for HYPE stands at 0.76 on Monday, the lowest level in a month. This ratio, being below one, reflects bearish sentiment in the market, as more traders are betting on the asset’s price to fall.
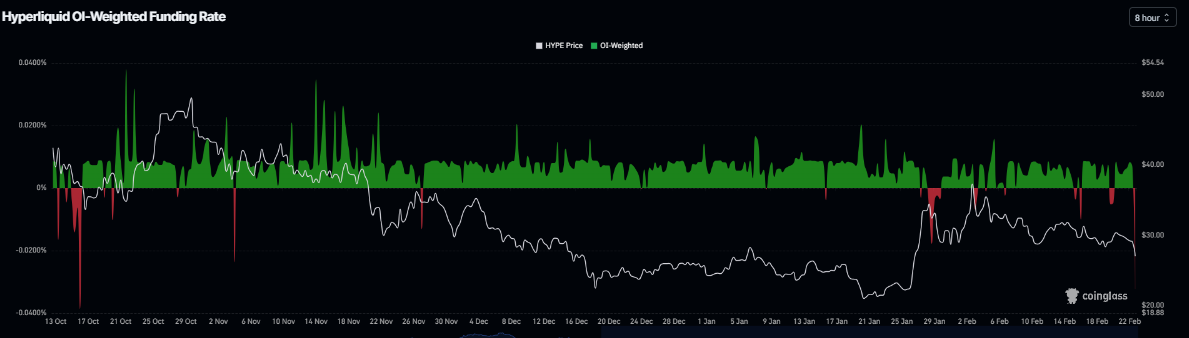
In addition, Coinglass’s OI-Weighted Funding Rate data shows a negative outlook. The metric turns negative on Monday and stands at -0.032%, nearing the October 16 levels, when HYPE dropped sharply. The negative ratio suggests that shorts are paying longs, suggesting bearish sentiment toward Hyperliquid.
Other concerns: Trump's tariff threats
Apart from the bearish sentiment from the derivatives markets, traders should be cautious about the growing tariff concerns. On Saturday, US President Donald Trump said that he would increase global tariffs to 15% from 10%. His remarks came one day after the Supreme Court struck down a broad swath of the president’s trade agenda.
In a Truth Social post, Trump stated that the new tariffs will be “effective immediately.” He also warned that additional levies would follow.
The asian markets opened the week on a negative note. Meanwhile, safe-haven asset Gold (XAU) has started with 1% gains, while risky assets such as Bitcoin have fallen below $65,000 so far on Monday. The shift in sentiment could further weigh on Hyperliquid prices, as tariff threats dampen risk appetite and broader market uncertainty persists.
Hyperliquid Price Forecast: HYPE momentum indicators show bearish signs
Hyperliquid price was rejected from the previously broken 100-day Exponential Moving Average (EMA) at $30.55 on Saturday, and declined 2.38% the next day. As of writing on Monday, HYPE continues its correction by over 4%.
If HYPE closes below the weekly support at $26.85 on a daily basis, it could extend the correction toward the next daily support at $23.91.
The Relative Strength Index (RSI) on the daily chart is 43, below the neutral level of 50, pointing downward, indicating bearish momentum gaining traction. The Moving Average Convergence Divergence (MACD) showed a bearish crossover on February 10, which remains intact, further supporting the negative outlook.
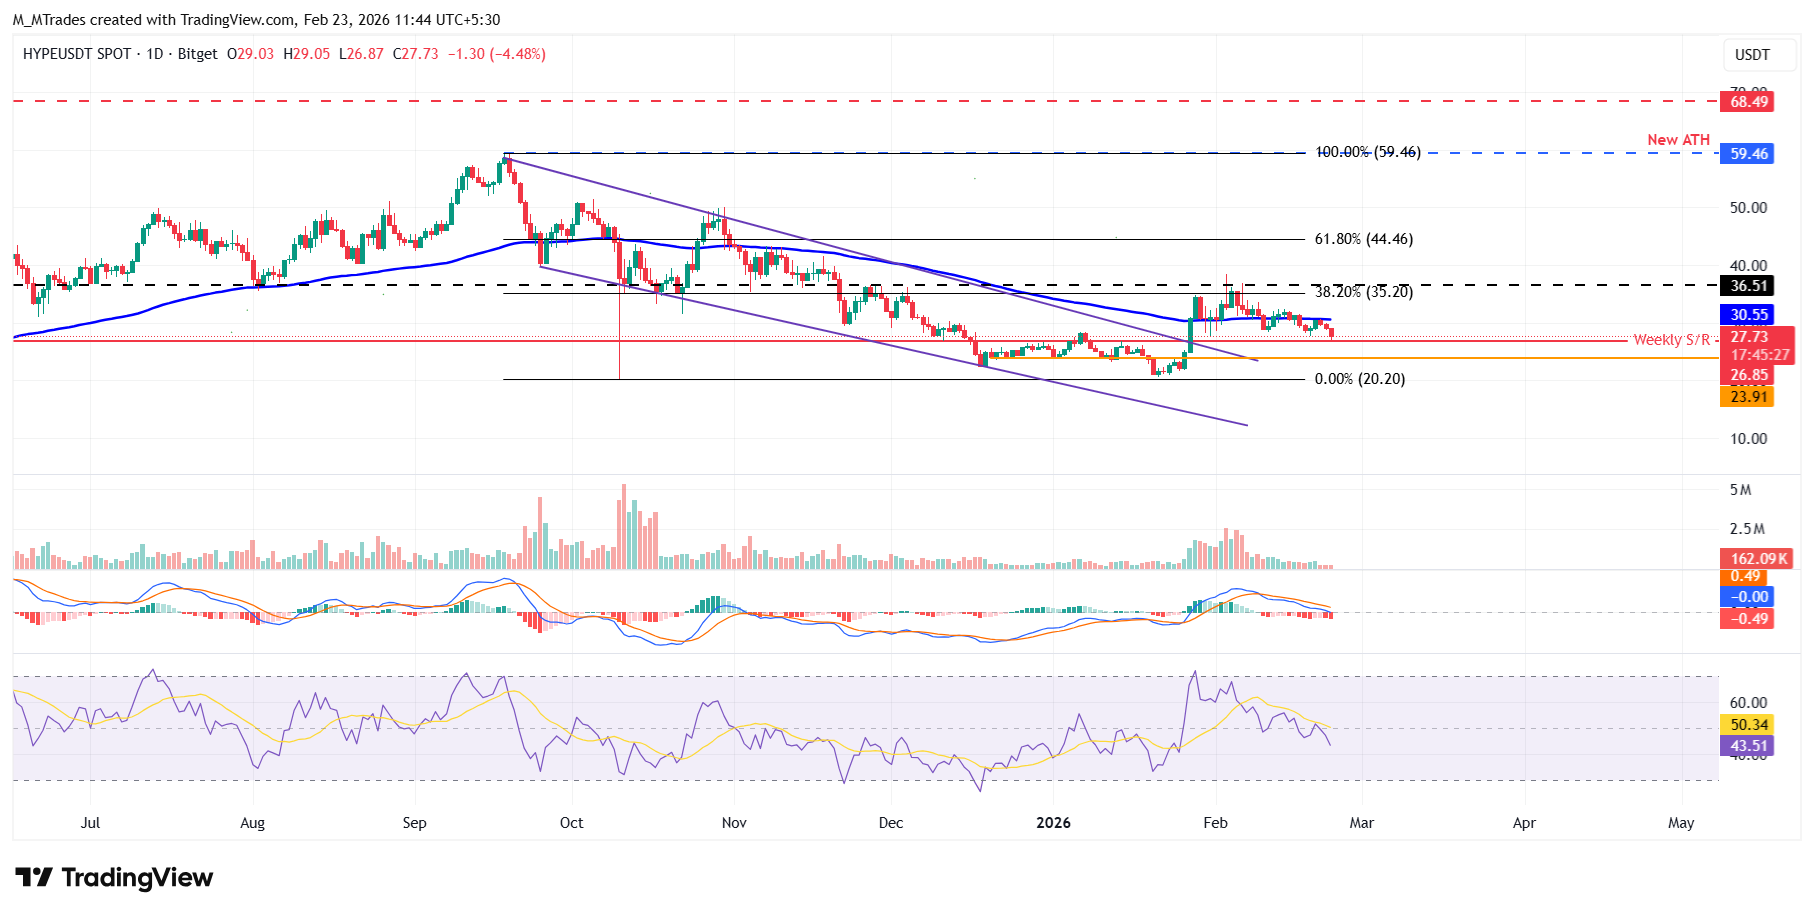
On the other hand, if the weekly support at $23.91 holds and recovers, HYPE could extend the advance toward the 100-day EMA at $30.55.

100만 명이 넘는 사용자가 FXStreet를 통해 실시간 시장 데이터, 차트 도구, 전문가 인사이트, 포렉스 뉴스를 이용합니다. 포괄적인 경제 캘린더와 교육 웨비나는 트레이더가 정보를 유지하고 신중한 결정을 내리도록 돕습니다. FXStreet는 바르셀로나 본사와 전 세계 지역에 걸쳐 약 60명의 팀으로 구성되어 있습니다.
더 읽기


