
Hyperliquid Price Forecast: Trendline break and bearish signals point to deeper correction
작성자 Manish Chhetri
수정됨: 14 May 2026


인기 기사

Hyperliquid (HYPE) extends its correction, trading below $39 at the time of writing on Thursday after closing below the rising trendline earlier this week. Mixed signals from the derivatives markets put a lid on HYPE’s recovery.
- Hyperliquid price extends its correction on Thursday after closing below the rising trendline earlier this week.
- Mixed derivatives signals among traders cap HYPE recovery.
- The technical outlook suggests a deeper correction, targeting levels below $37.
Hyperliquid (HYPE) extends its correction, trading below $39 at the time of writing on Thursday after closing below the rising trendline earlier this week. Mixed signals from the derivatives markets put a lid on HYPE’s recovery. On the technical side, bearish momentum strengthens with bears aiming for levels below $37.
Mixed sentiment keeps bulls cautious
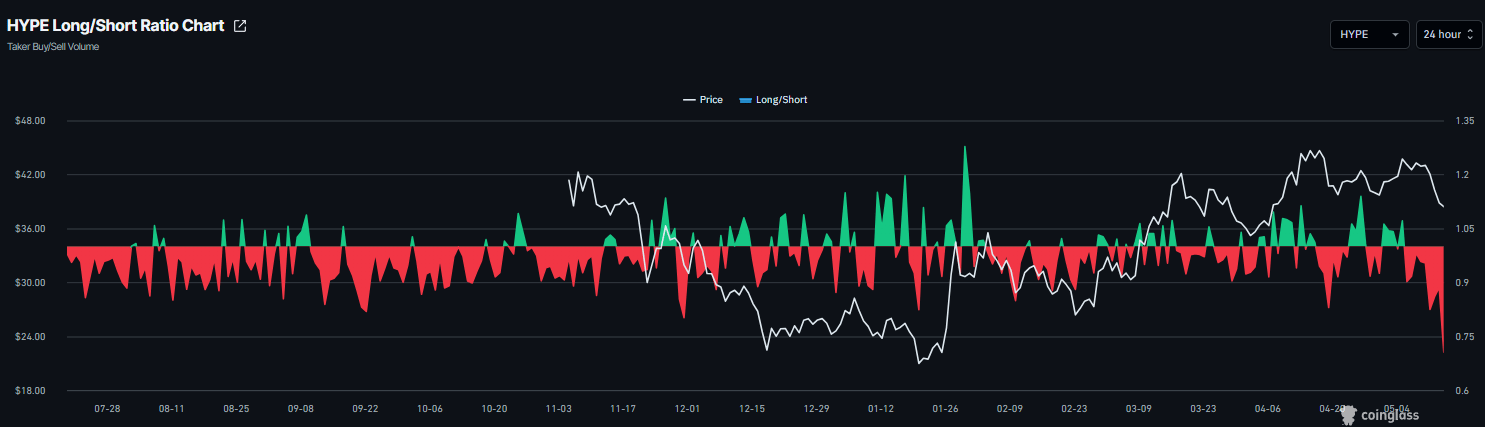
Hyperliquid’s derivatives data shows mixed signals, keeping the bulls cautious. CoinGlass’ long-to-short ratio for HYPE reads 0.70 on Thursday, the lowest level over a month. This ratio, being below one, reflects bearish sentiment in the market, as more traders are betting on the asset’s price to fall.
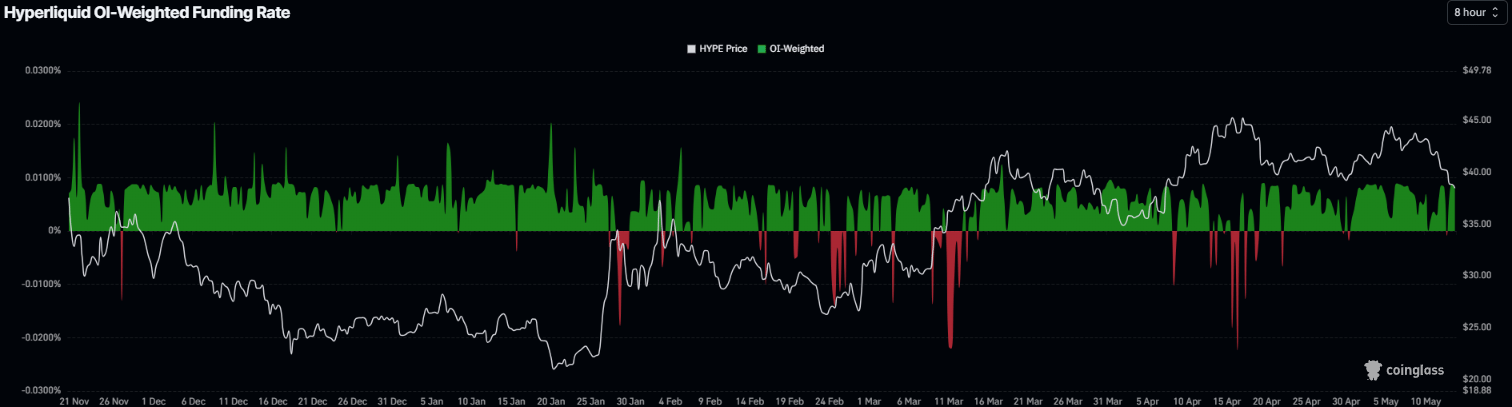
Meanwhile, the funding rates support improving sentiment. CoinGlass’ OI-Weighted Funding Rate data for HYPE flipped positive on Wednesday and reads 0.0078% on Thursday. This positive rate indicates that longs are paying shorts and projecting a bullish sentiment.
This combination of derivatives metrics suggests indecision among HYPE investors and a lack of clear directional bias, which limits the likelihood of a sustained recovery.
Hyperliquid Price Forecast: HYPE bears are in control of the momentum
Hyperliquid price broke and closed below the rising trendline (drawn by connecting multiple highs since the end of January) on Tuesday and corrected by over 7% through the next day. At the time of writing on Thursday, HYPE is extending the correction, trading below $39.
If HYPE continues its pullback and closes below the 200-day Exponential Moving Average (EMA) at $37.88, it could extend the losses toward the 200-day EMA at $36.09.
Momentum indicators also show a bearish outlook. The Relative Strength Index (RSI) on the daily chart reads 37, slipping below the neutral level, and the Moving Average Convergence Divergence (MACD) indicators on the same chart showed a bearish crossover on Monday, projecting a negative outlook.
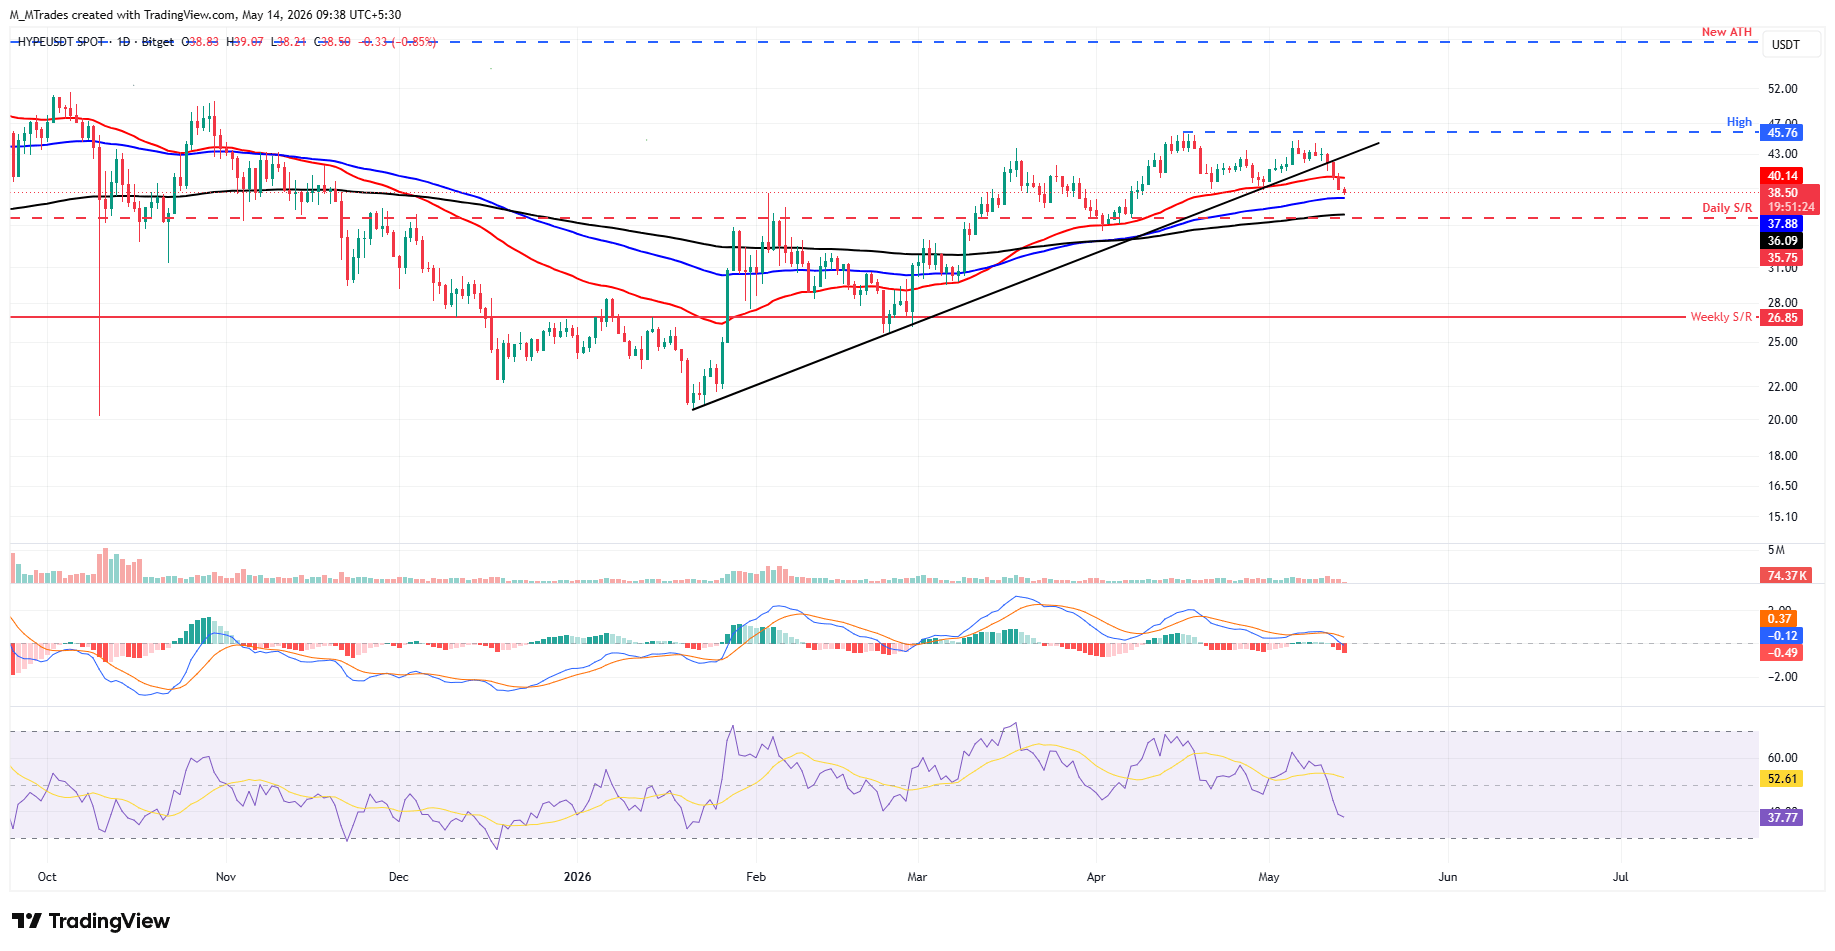
If Hyperliquid recovers, it could extend the advance toward the 50-day EMA at $40.11.

100만 명이 넘는 사용자가 FXStreet를 통해 실시간 시장 데이터, 차트 도구, 전문가 인사이트, 포렉스 뉴스를 이용합니다. 포괄적인 경제 캘린더와 교육 웨비나는 트레이더가 정보를 유지하고 신중한 결정을 내리도록 돕습니다. FXStreet는 바르셀로나 본사와 전 세계 지역에 걸쳐 약 60명의 팀으로 구성되어 있습니다.
더 읽기


