
LayerZero support holds as Kelp DAO rsETH hack drains DeFi liquidity, spiking borrowing rates
작성자 John Isige
수정됨: 23 Apr 2026


인기 기사

LayerZero (ZRO) is trading at $1.58 at the time of writing on Thursday, rising from the daily low of $1.54. Despite sentiment broadly improving across the crypto market, interest in ZRO has remained subdued, especially in the retail market.
- LayerZero’s slight increase to $1.58 on Thursday shrugs off weak technicals as the MACD maintains a sell signal.
- The Kelp DAO rsETH exploit is sending ripples through the DeFi sector, shrinking liquidity on the Aave platform by 33%.
- Borrowing rates on Ethereum and stablecoins spiked following the hack and the liquidity crunch caused by aggressive withdrawals.
LayerZero (ZRO) is trading at $1.58 at the time of writing on Thursday, rising from the daily low of $1.54. Despite sentiment broadly improving across the crypto market, interest in ZRO has remained subdued, especially in the retail market.
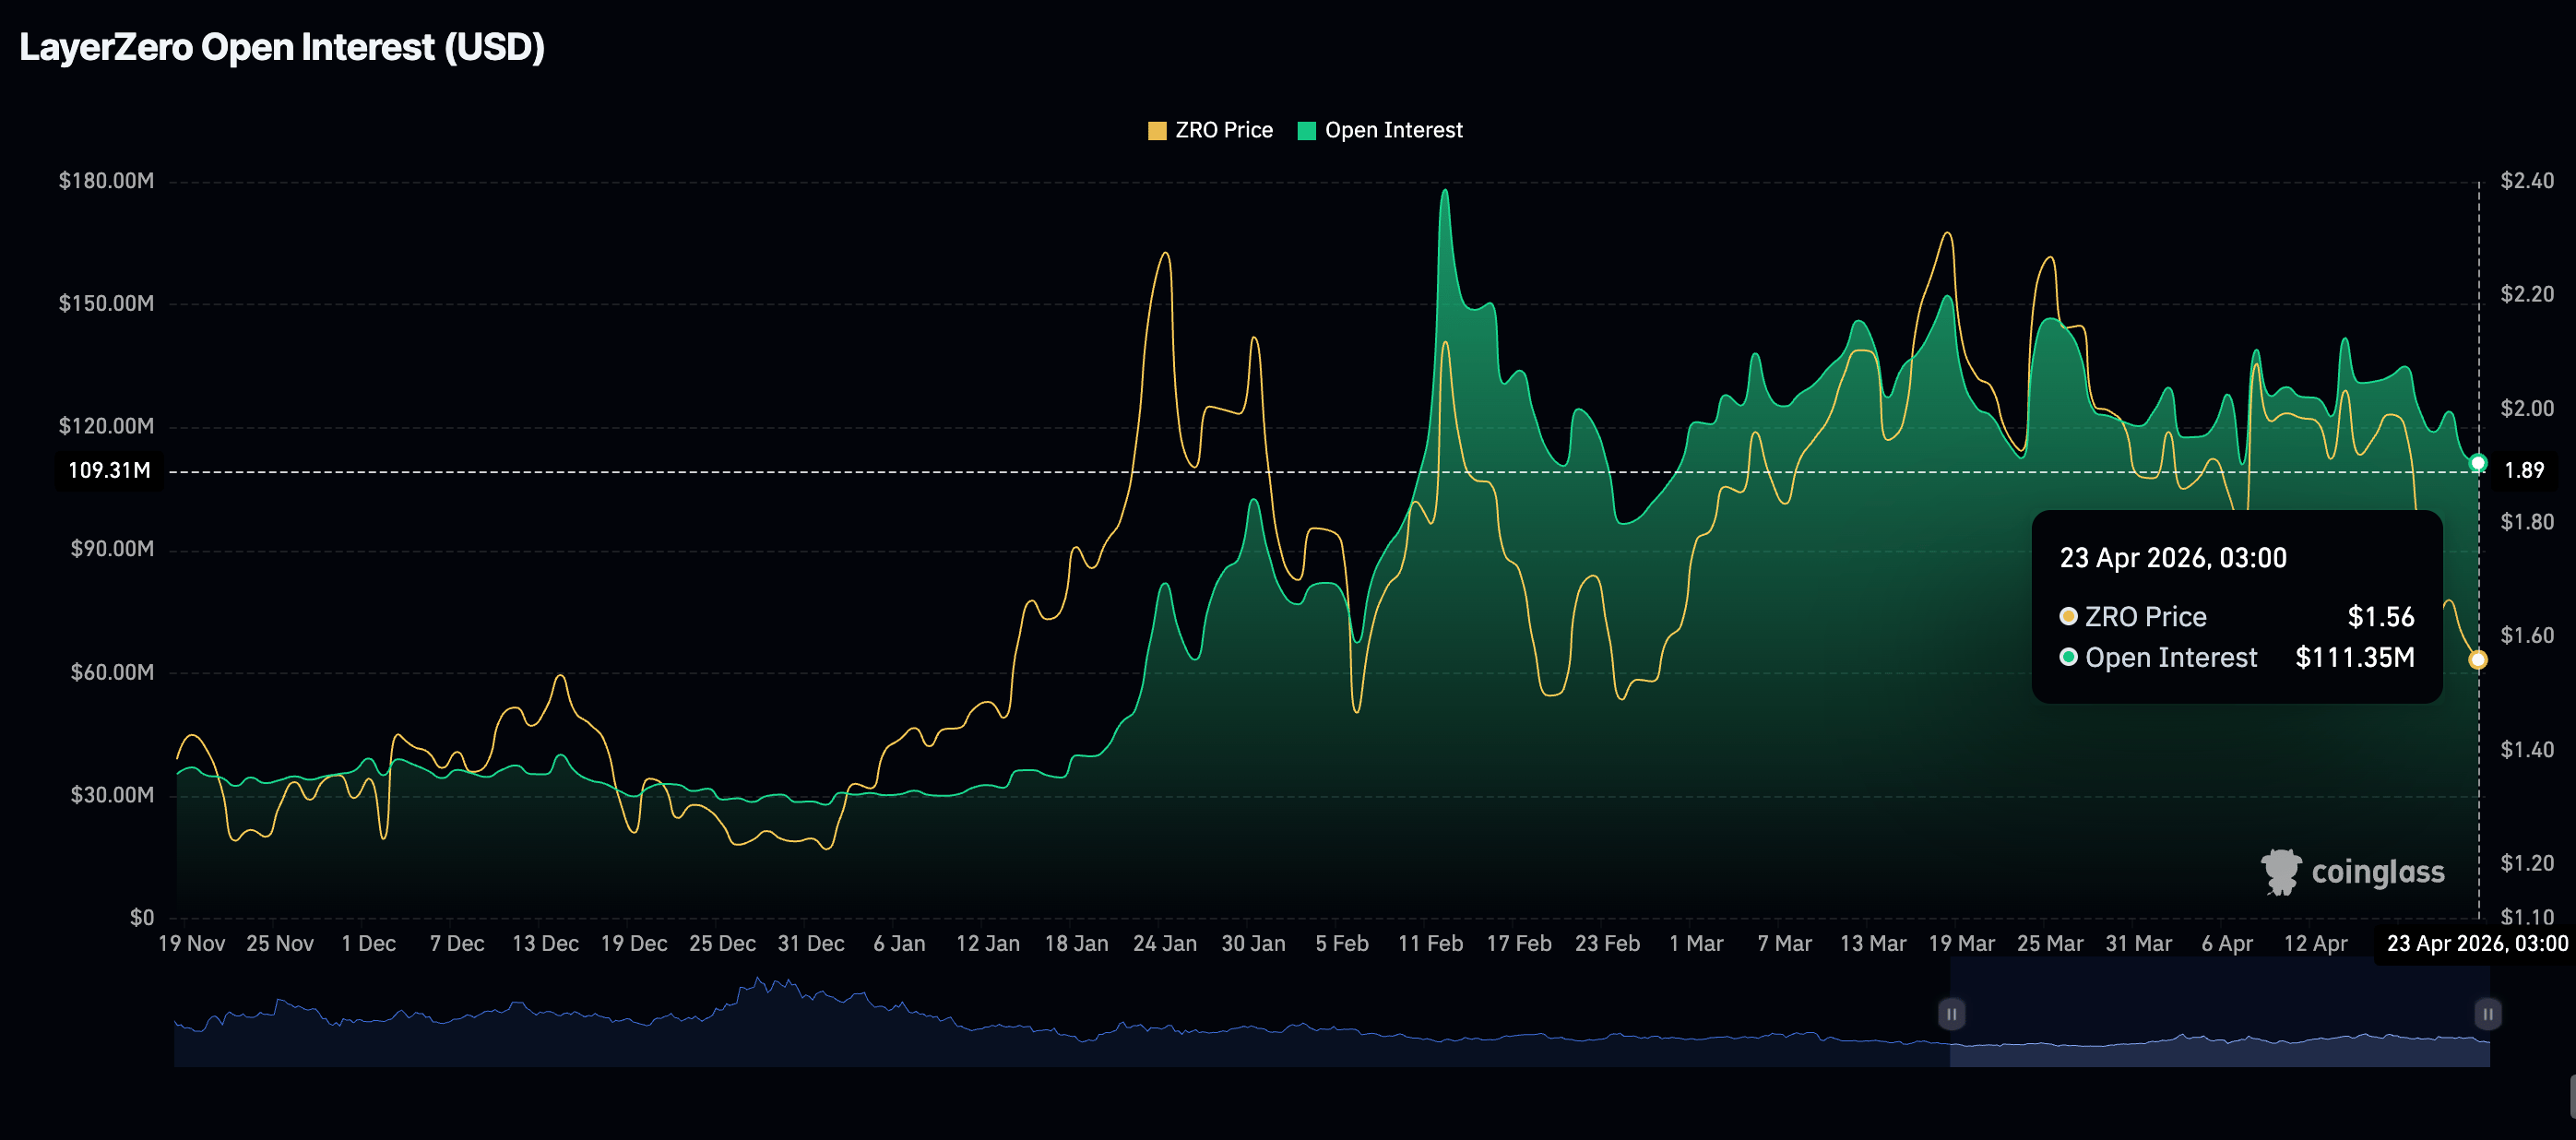
The perpetual futures Open Interest (OI) has continued to weaken, averaging $111 million on Thursday, down from nearly $114 million the previous day. CoinGlass data shows that the OI peaked at roughly $142 million on April 14, undermining the prevailing retail demand.
Kelp DAO rsETH exploit drains liquidity, hiking DeFi borrowing rates
The recent exploit on Kelp DAO rsETH, which resulted in losses of up to $290 million in the liquid staking token rsETH, is sending shockwaves through the Decentralized Finance (DeFi) sector.
After the attacker minted unbacked rsETH tokens, CryptoQuant’s report says that they were deposited into the Aave (AAVE) platform and exchanged for WETH and stablecoins.
Since Aave holds roughly 83% of the rsETH supply in its aETHrsETH contract, the exploit exposed the protocol to an estimated $124 million to $230 million in potential bad debt.
Aave’s DeFi total value locked (TVL) dropped by approximately 33% from $45 billion to $30 billion over a three-day period following the exploit, resulting in a historical liquidity crunch in the DeFi sector.
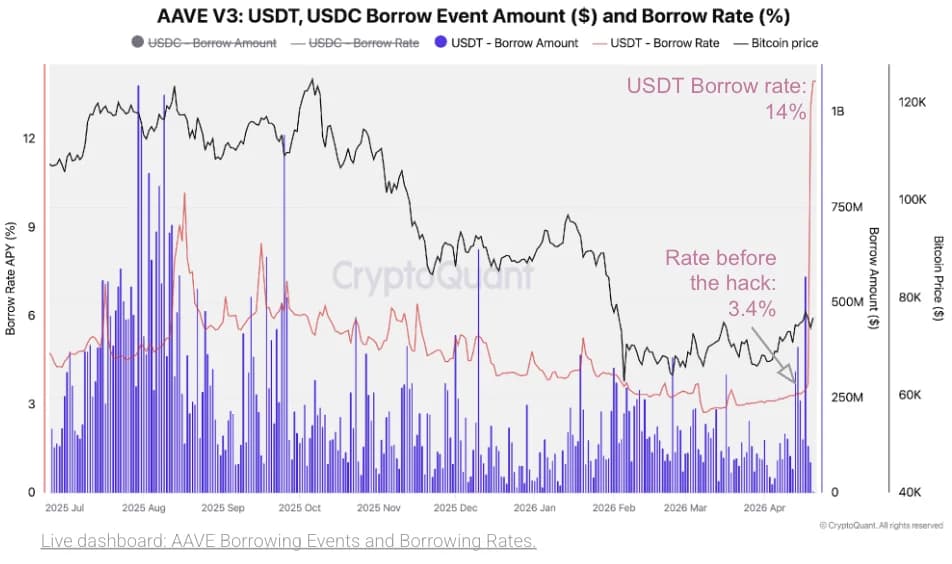
Borrowing rates on Ethereum (ETH) and stablecoins spiked as investors rushed to withdraw assets, further exacerbating the liquidity crunch. USDT and USDC borrowing rates on Aave V3 shot up to 14% from 3.4%, as users turned to stablecoins borrowing to exit the protocol.
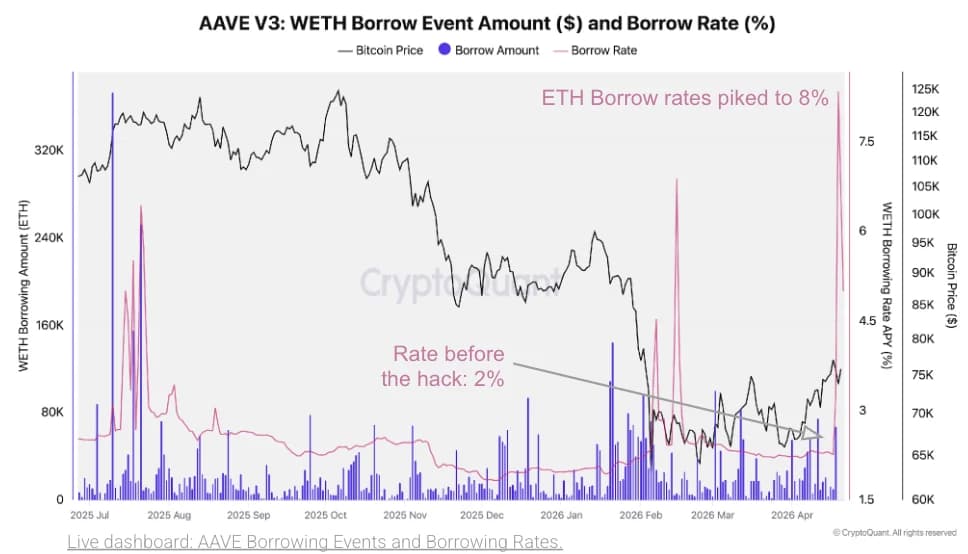
CryptoQuant states that “ETH borrowing rates spiked to 8%, the highest since at least January 2024, before stabilizing at approximately 5%, more than double the pre-hack level of 2%. ETH, USDC, and USDT are by far the three largest markets on AAVE.”
In a statement issued on Monday, LayerZero attributed the exploitation to the infamous Lazarus Group. LayerZero added that the incident was isolated to KelpDAO’s rsETH configuration and that there was zero contagion to other assets or applications in the ecosystem.
Technical outlook: ZRO mild rebound lacks support
LayerZero trades at $1.58, extending its decline after losing the rising support trendline, which now caps the upside around $1.61. The price holds well below the 50-day, 100-day and 200-day Exponential Moving Averages (EMAs), reinforcing a bearish near-term bias as rallies are rejected beneath a dense band of overhead supply.
Moreover, the Moving Average Convergence Divergence (MACD) histogram remains in negative territory on the daily chart, while the Relative Strength Index (RSI) hovers near 36, suggesting persistent downward pressure, although the RSI is approaching oversold territory.
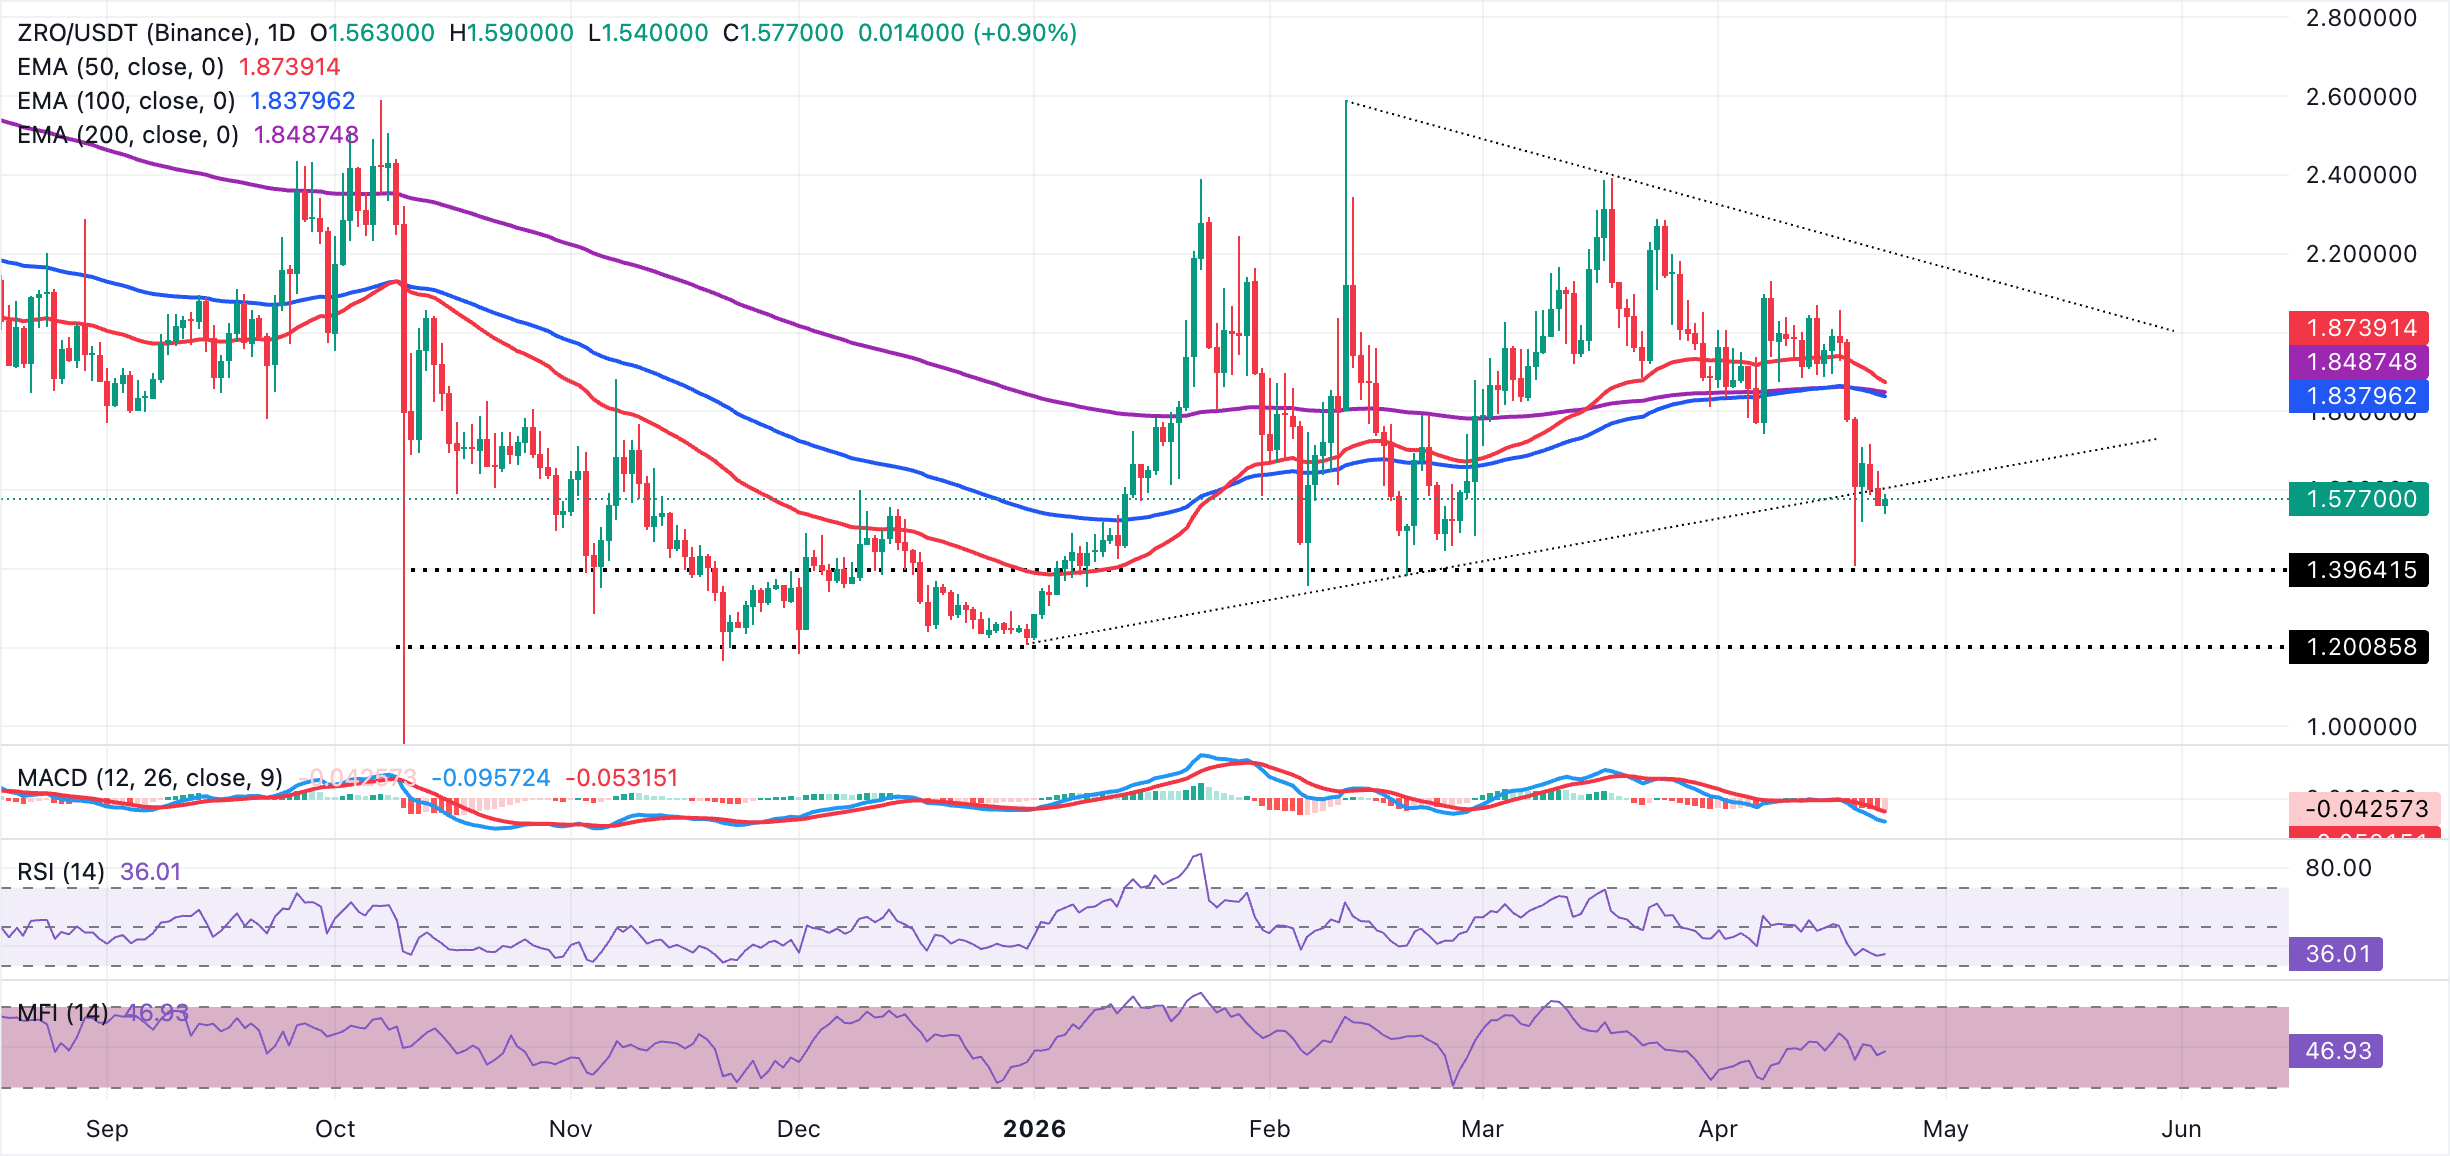
On the topside, initial resistance emerges near the former ascending trendline at $1.61, with further barriers at the 100-day EMA close to $1.84, the 200-day EMA near $1.85, and the 50-day EMA at $1.87. The EMAs form a broad supply zone that would need to be reclaimed to ease the bearish tone. Initial support lies at the daily low around $1.54. A sustained break below this level could accelerate the decline to the horizontal demand zone at $1.40.
(The technical analysis of this story was written with the help of an AI tool.)
Cryptocurrency metrics FAQs
The developer or creator of each cryptocurrency decides on the total number of tokens that can be minted or issued. Only a certain number of these assets can be minted by mining, staking or other mechanisms. This is defined by the algorithm of the underlying blockchain technology. On the other hand, circulating supply can also be decreased via actions such as burning tokens, or mistakenly sending assets to addresses of other incompatible blockchains.
Market capitalization is the result of multiplying the circulating supply of a certain asset by the asset’s current market value.
Trading volume refers to the total number of tokens for a specific asset that has been transacted or exchanged between buyers and sellers within set trading hours, for example, 24 hours. It is used to gauge market sentiment, this metric combines all volumes on centralized exchanges and decentralized exchanges. Increasing trading volume often denotes the demand for a certain asset as more people are buying and selling the cryptocurrency.
Funding rates are a concept designed to encourage traders to take positions and ensure perpetual contract prices match spot markets. It defines a mechanism by exchanges to ensure that future prices and index prices periodic payments regularly converge. When the funding rate is positive, the price of the perpetual contract is higher than the mark price. This means traders who are bullish and have opened long positions pay traders who are in short positions. On the other hand, a negative funding rate means perpetual prices are below the mark price, and hence traders with short positions pay traders who have opened long positions.

100만 명이 넘는 사용자가 FXStreet를 통해 실시간 시장 데이터, 차트 도구, 전문가 인사이트, 포렉스 뉴스를 이용합니다. 포괄적인 경제 캘린더와 교육 웨비나는 트레이더가 정보를 유지하고 신중한 결정을 내리도록 돕습니다. FXStreet는 바르셀로나 본사와 전 세계 지역에 걸쳐 약 60명의 팀으로 구성되어 있습니다.
더 읽기


