

Lido DAO Price Forecast: LDO bulls retain control and target $0.30
- Lido DAO extends gains for the seventh consecutive day, trading around $0.28 on Tuesday.
- LDO faces reduced but steady retail participation, with futures Open Interest averaging 145 million.
- LDO builds momentum, supported by a MACD buy signal and a bullish RSI.
Lido DAO (LDO) maintains a bullish short-term bias, trading around $0.28 at the time of writing on Tuesday. The liquid staking token (LST) has logged consistent gains since last Wednesday, indicating growing risk appetite.
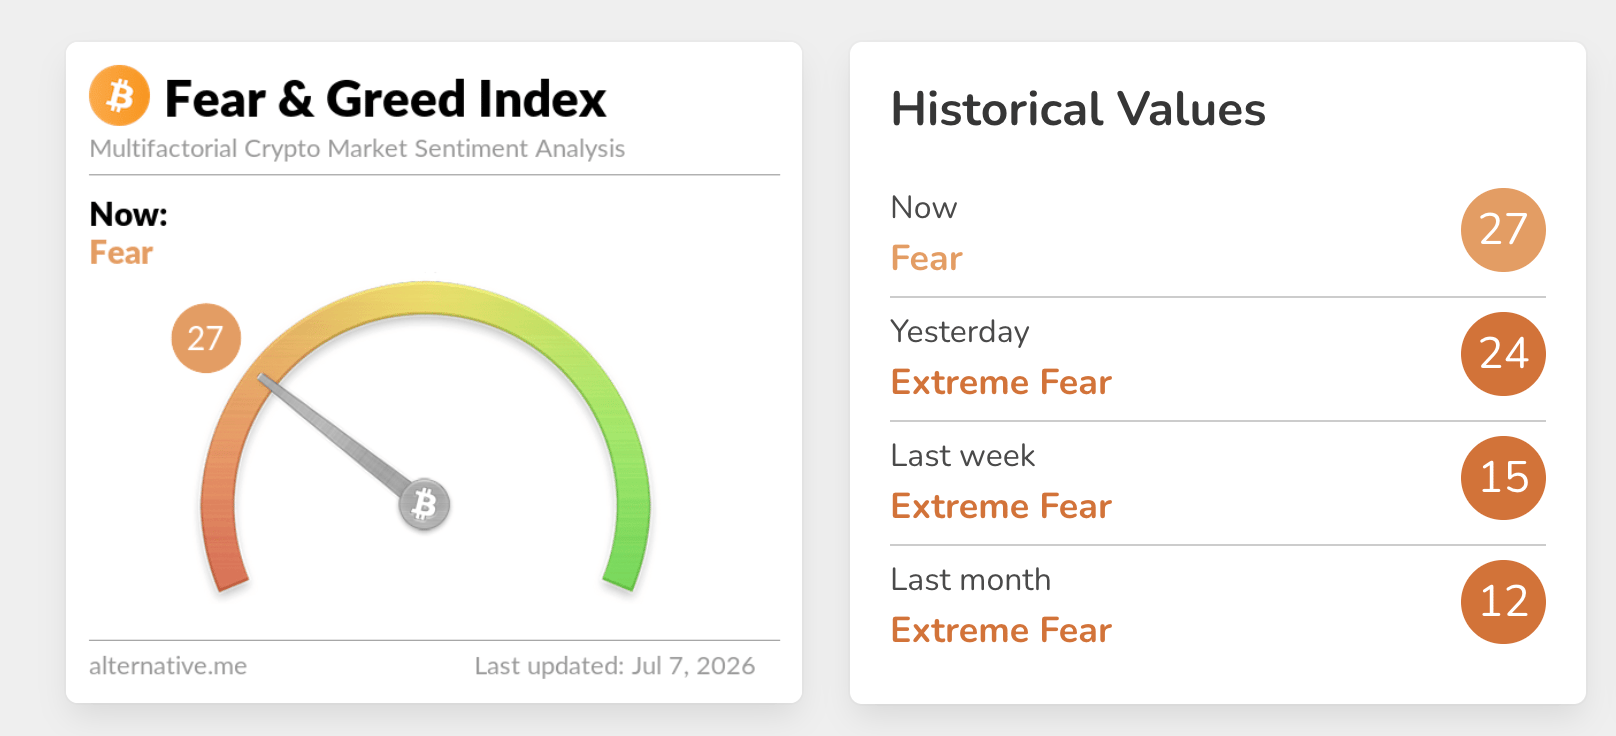
Sentiment in the broader crypto market has also improved but only marginally, as reflected in the Fear & Greed Index at 27 in the Fear Territory on Tuesday, from 24 the day before. Should bullish momentum persist and broader risk appetite in the crypto market grow, the probability of a robust LDO recovery will rise significantly.

Suppressed retail interest could limit LDO's recovery
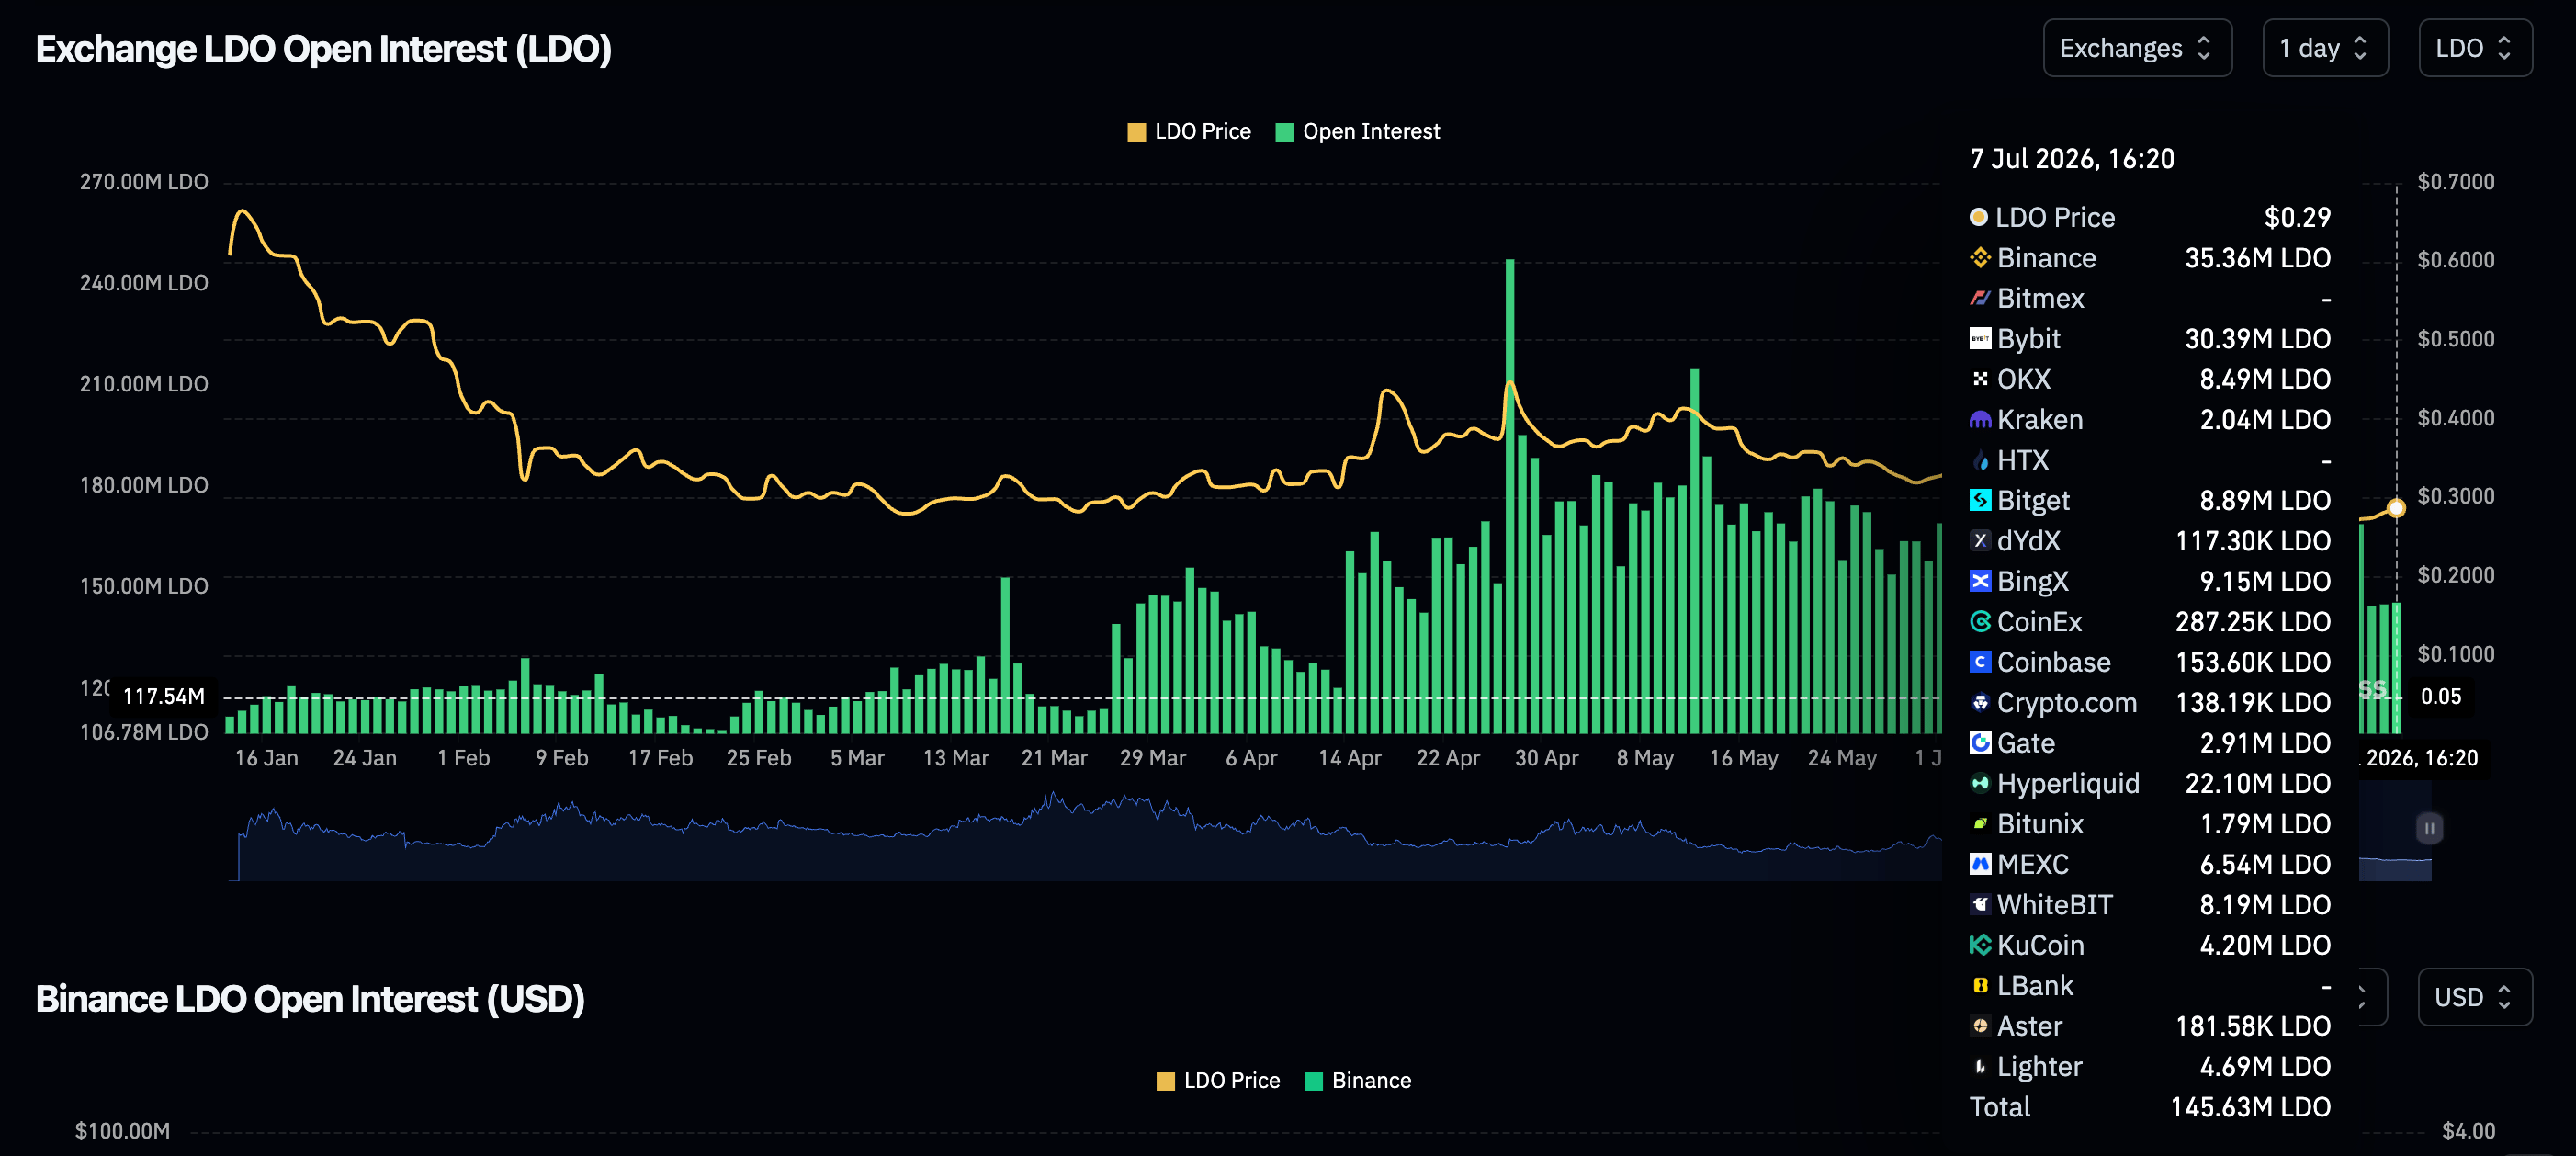
Retail participation in Lido DAO remains relatively subdued, as reflected in the perpetual futures Open Interest (OI), with an average of 145 million LDO over a three-day period.
Looking back, OI registered 169 million LDO on Saturday, a notable decline from the 247 million LDO observed in late April. For LDO to maintain upward momentum over the short- to medium-term, a sustained uptick in retail risk appetite remains essential.
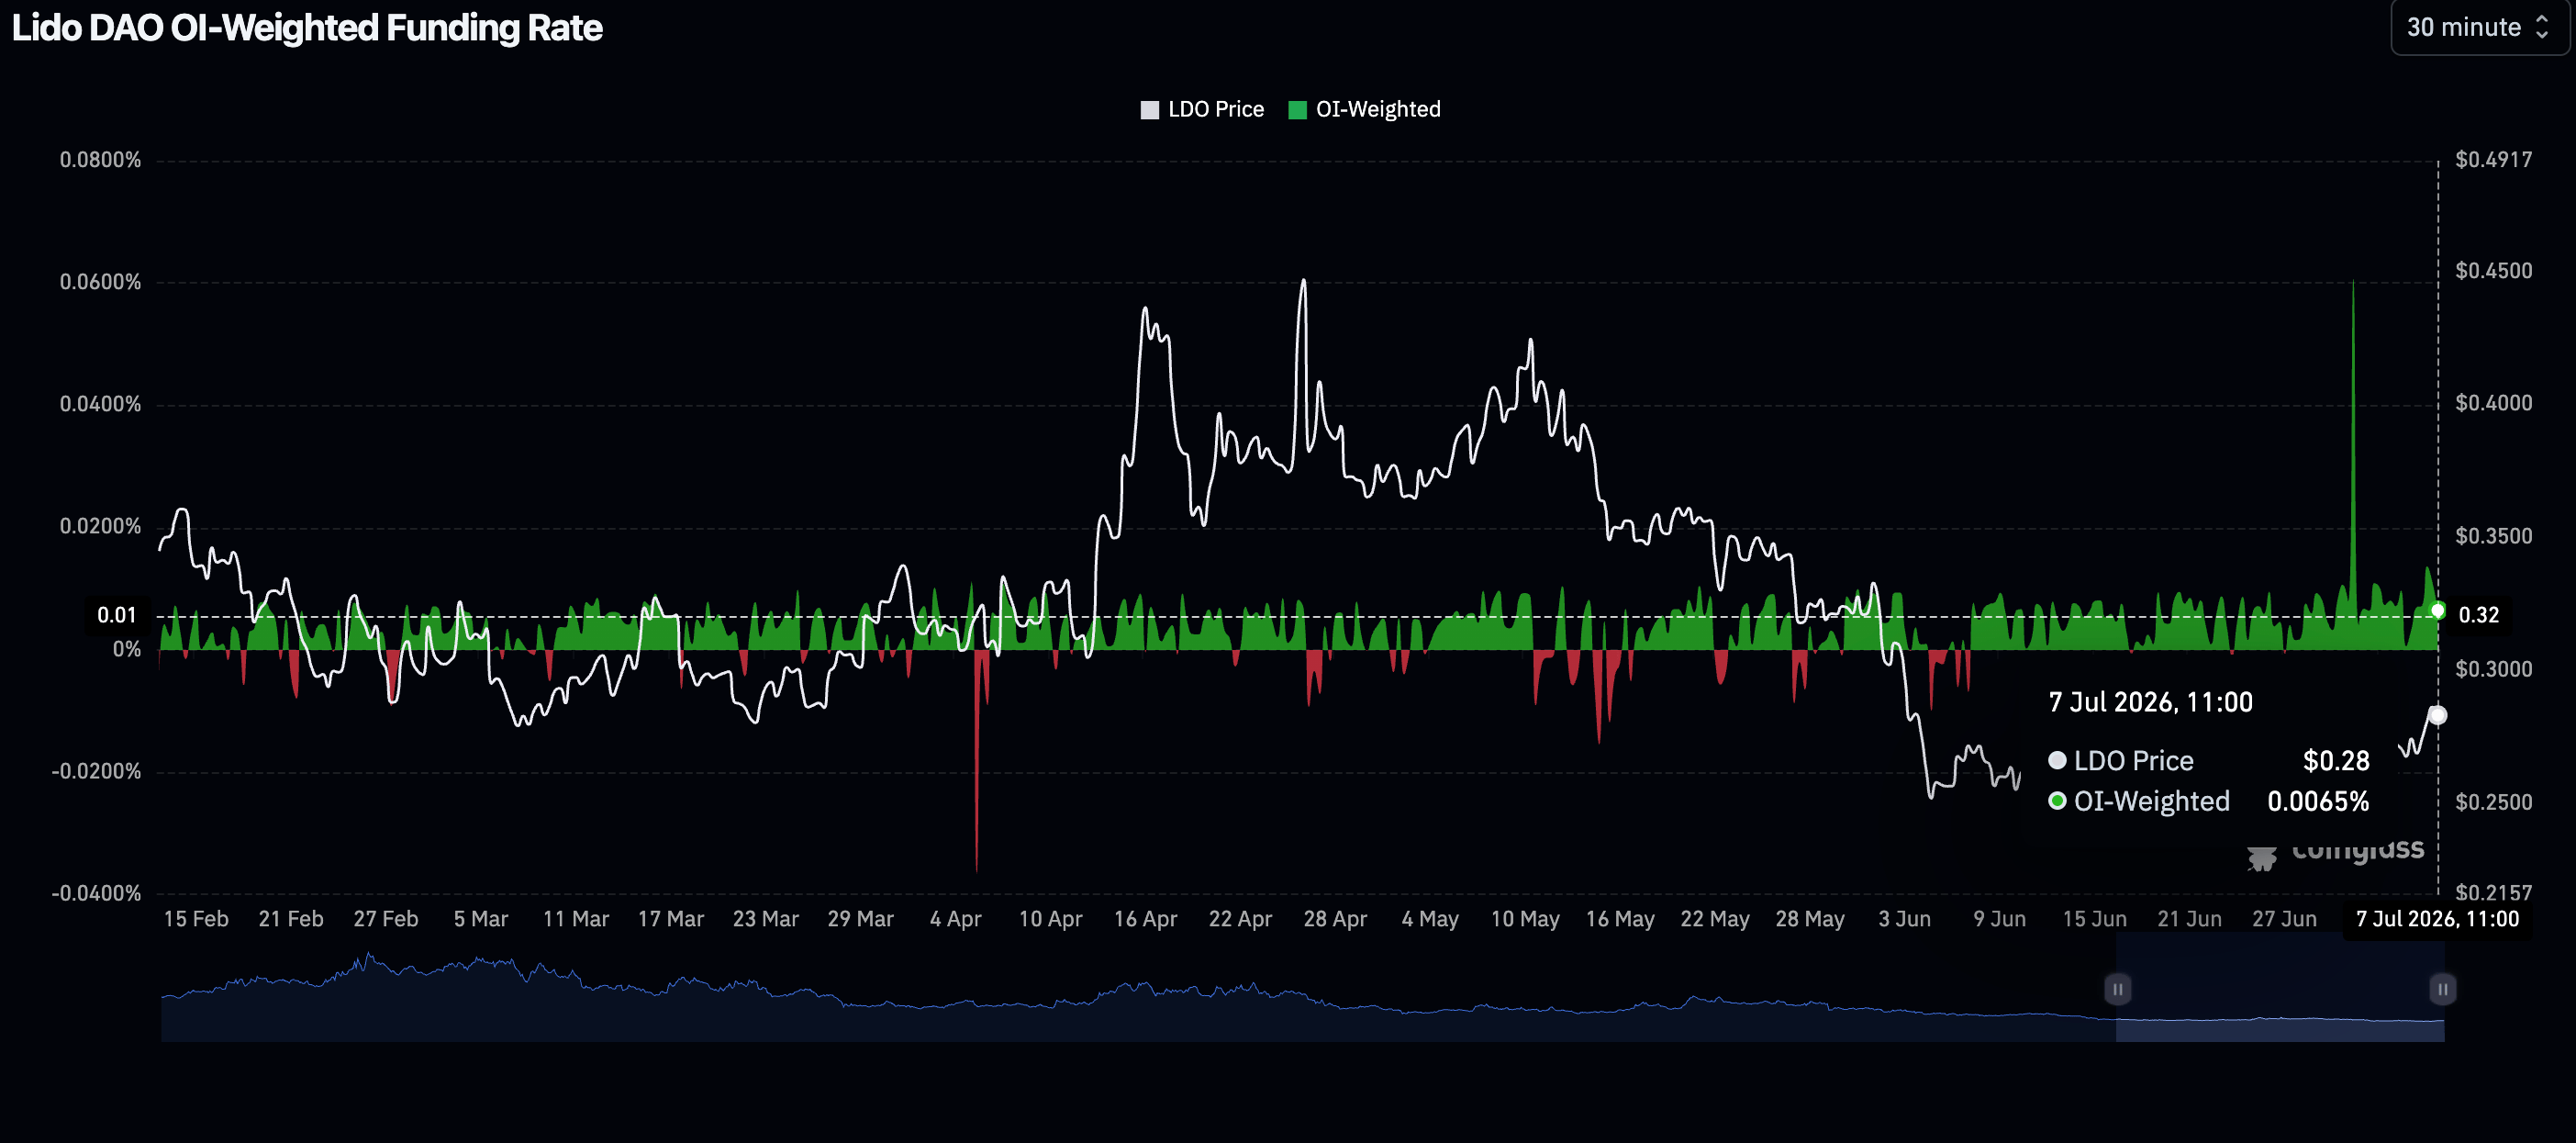
Meanwhile, leverage remains positive, as shown by the OI-Weighted Funding Rate of 0.0065% on Tuesday. In hindsight, bulls have since early June increasingly paid a premium to retail their long positions.
Price analysis: LDO extends gains as buyers tighten grip
LDO trades at $0.29, with its upside capped by the key moving averages. The LST token sits just under the 50-day Exponential Moving Average (EMA) at $0.29 and remains well below the 100-day and 200-day EMAs at $0.32 and $0.42, respectively, keeping the near-term bias bearish despite the recent rebound.
The Parabolic SAR at $0.24 now trails below price as underlying support, while the Moving Average Convergence Divergence (MACD) histogram has turned increasingly positive on the daily chart, suggesting improving upside momentum.
At the same time, the Relative Strength Index (RSI) around 59 on the same chart points to recovering bullish pressure but stops short of overbought territory.
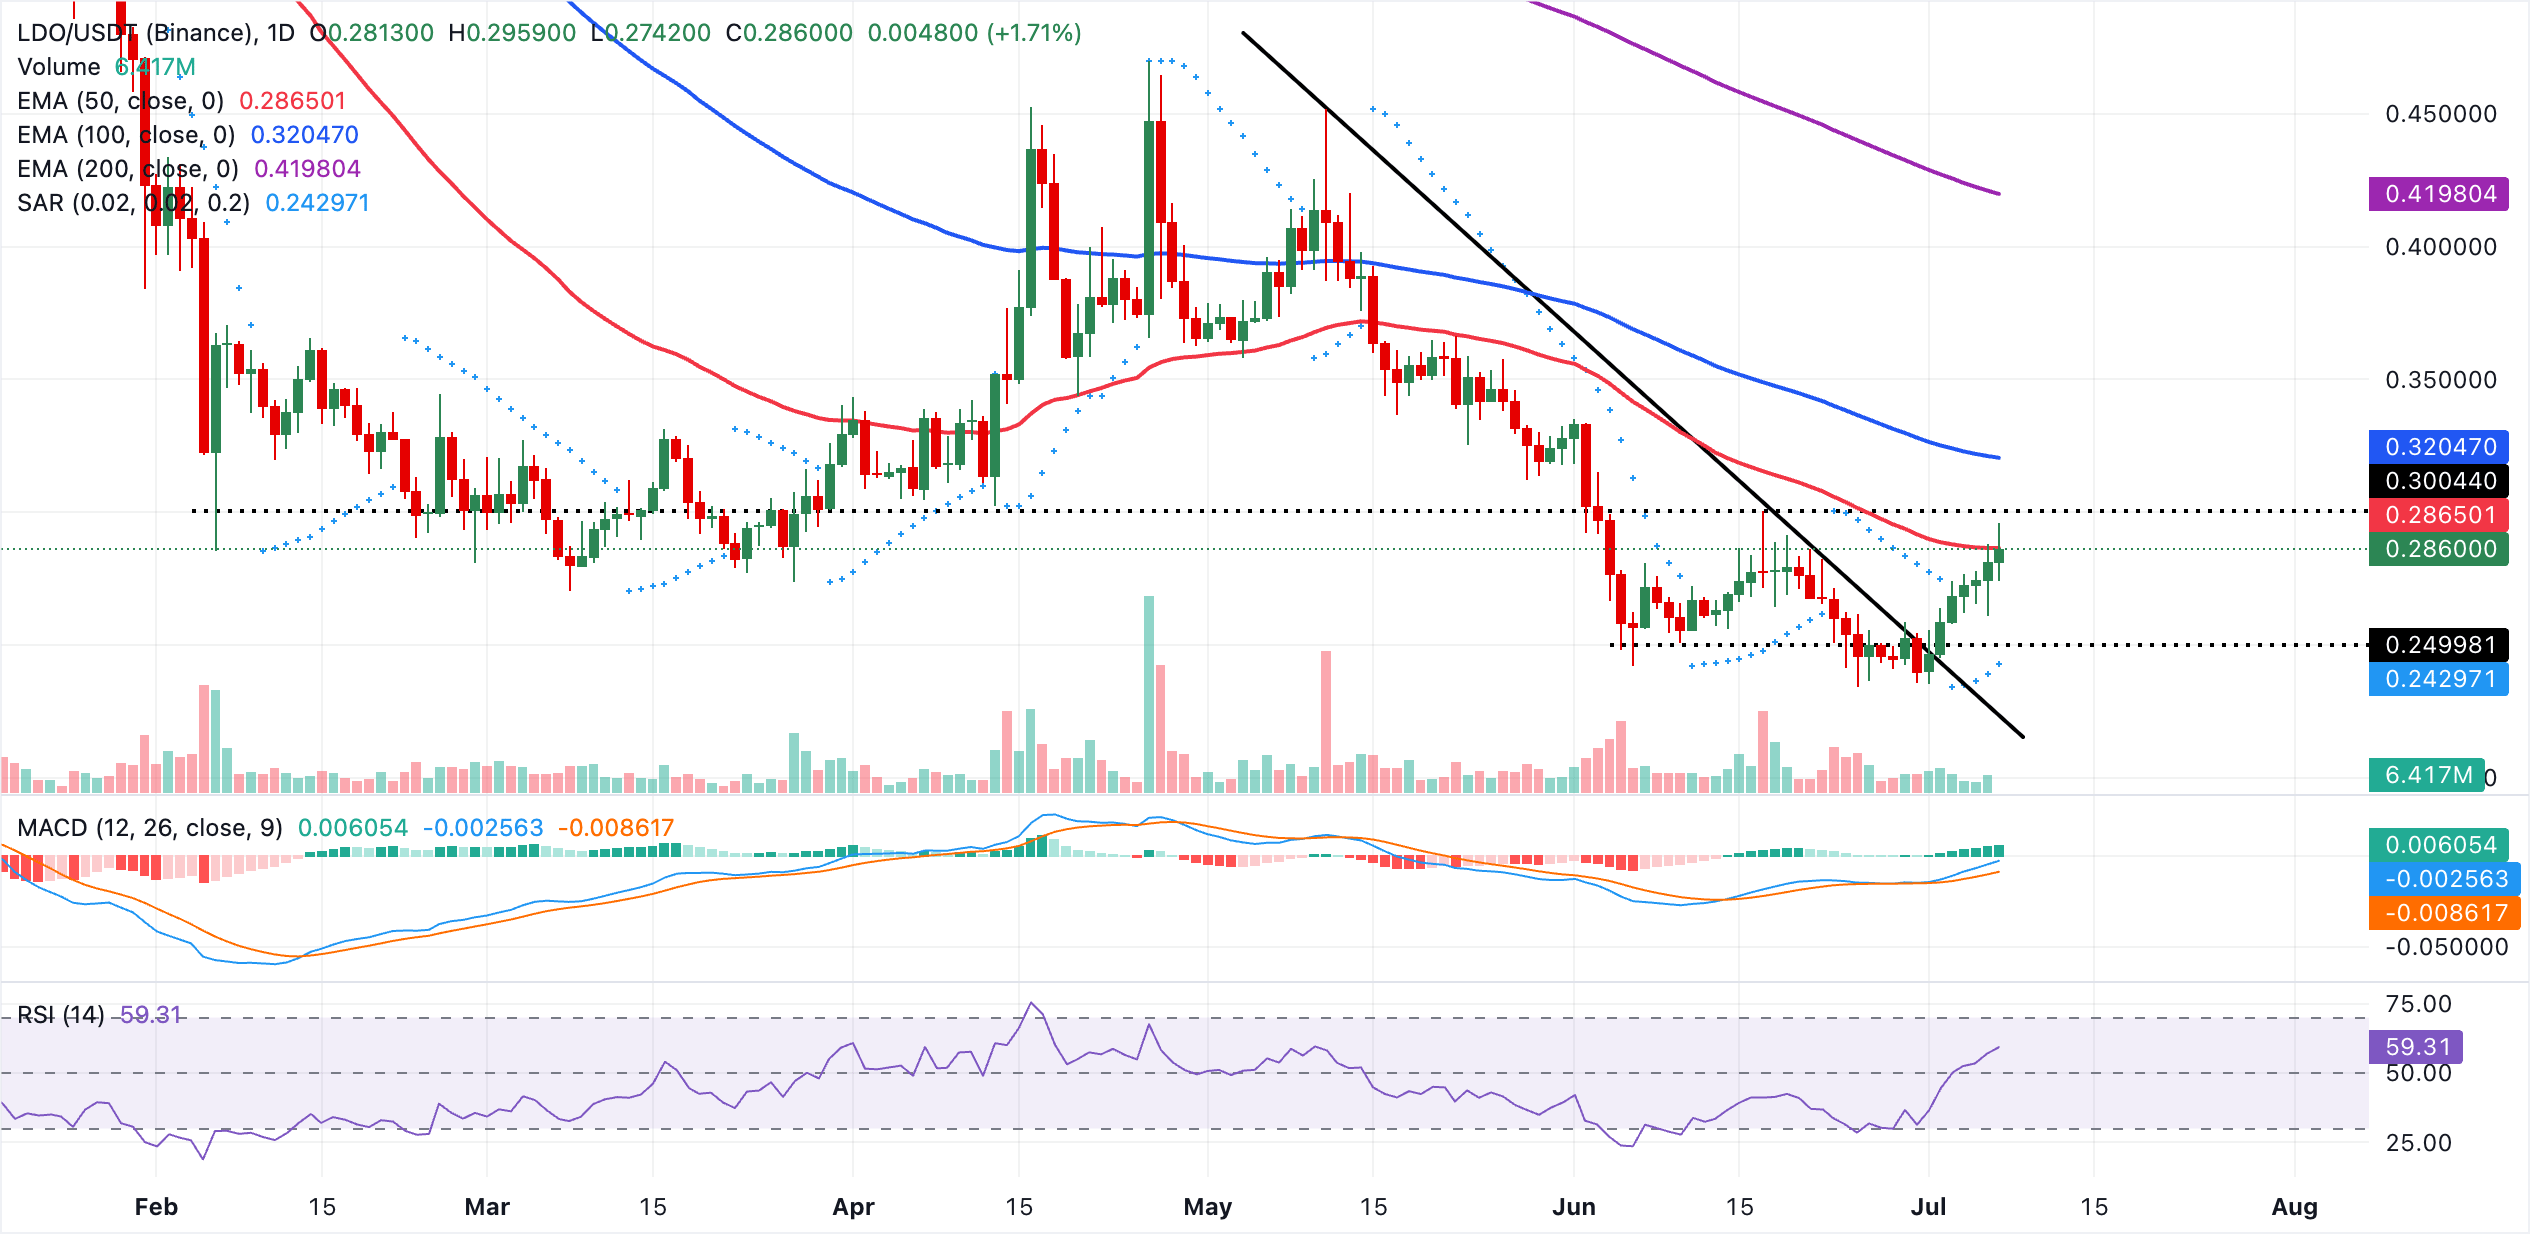
Immediate resistance lies at the 50-day EMA near $0.29, followed by the 100-day EMA at $0.32, while the 200-day EMA at $0.42 marks a broader bearish cap on any extended rally. On the flip side, initial support is seen at the Parabolic SAR around $0.24, with a deeper cushion at the descending trendline break zone near $0.22, where buyers would be expected to reassert if the current pullback extends.
(The technical analysis of this story was written with the help of an AI tool. Know more.)
Open Interest, funding rate FAQs
Higher Open Interest is associated with higher liquidity and new capital inflow to the market. This is considered the equivalent of increase in efficiency and the ongoing trend continues. When Open Interest decreases, it is considered a sign of liquidation in the market, investors are leaving and the overall demand for an asset is on a decline, fueling a bearish sentiment among investors.
Funding fees bridge the difference between spot prices and prices of futures contracts of an asset by increasing liquidation risks faced by traders. A consistently high and positive funding rate implies there is a bullish sentiment among market participants and there is an expectation of a price hike. A consistently negative funding rate for an asset implies a bearish sentiment, indicating that traders expect the cryptocurrency’s price to fall and a bearish trend reversal is likely to occur.














