
Litecoin Price Analysis: LTC holds key support, recovery prospects emerge
작성자 Manish Chhetri
게시일: 26 Jan 2026 | 수정일: 26 Jan 2026


인기 기사

Litecoin (LTC) price recovers slightly, trading above $68 at the time of writing on Monday, after finding support around the lower boundary of the falling wedge pattern. Improving on-chain and derivatives signals suggest a potential recovery in LTC if buyers continue to defend the key support zone.
- Litecoin price hovers around $68 on Monday, finding support near the lower trendline of a falling wedge pattern.
- On-chain and derivatives data lean constructive, with large whale buy orders, buy-side dominance and positive funding rates supporting a recovery scenario.
- Technical outlook suggests a potential rebound if the lower trendline continues to hold as support.
Litecoin (LTC) price recovers slightly, trading above $68 at the time of writing on Monday, after finding support around the lower boundary of the falling wedge pattern. Improving on-chain and derivatives signals suggest a potential recovery in LTC if buyers continue to defend the key support zone.
Litecoin’s on-chain and derivatives support a potential recovery
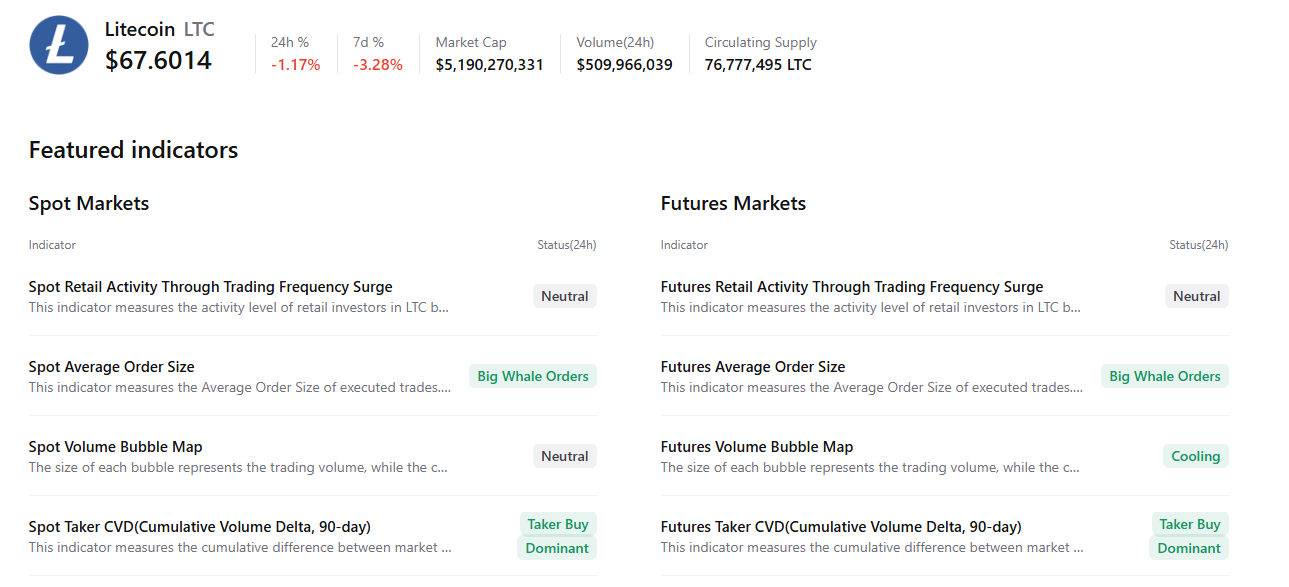
CryptoQuant’s summary chart below supports a positive outlook, as Litecoin’s spot and futures markets show large whale orders and buy-side dominance. In addition, the futures market signals cooling conditions, and all these factors support a potential recovery ahead.
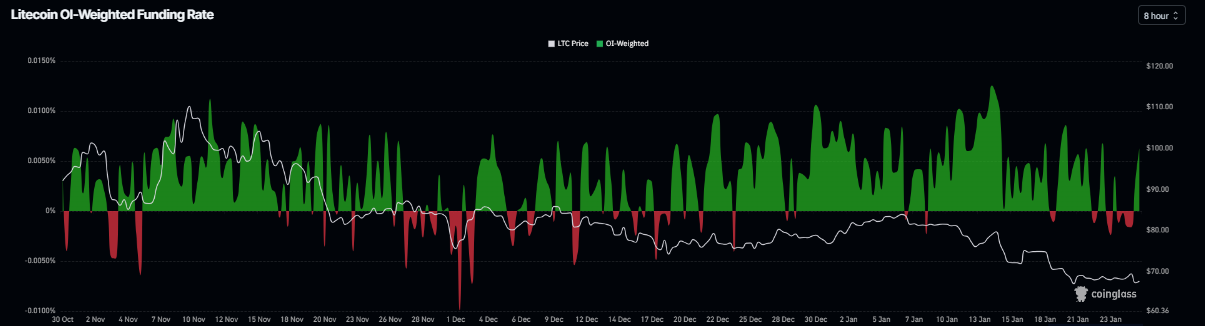
CoinGlass’s OI-Weighted Funding Rate data shows that the number of traders betting that the price of Litecoin will slide further is lower than that anticipating a price increase.
The metric has flipped a positive rate on Sunday and currently reads 0.0063%, indicating that longs are paying shorts. Generally, when funding rates flip from negative to positive, Litecoin has recovered.
Litecoin Price Forecast: LTC could recover if the key support holds
Litecoin price was rejected from the 50-day Exponential Moving Average (EMA) at $77.39 on January 14 and declined nearly 18% in the next 10 days, retesting the April 9 low of $66.51 last week. LTC price has been consolidating around the lower boundary of the falling wedge pattern (drawn by connecting multiple highs and lows since mid-October) over the last four days. As of Monday, it trades around $68.14.
If the lower trendline holds as support, LTC could extend its recovery toward the weekly resistance at $77.19, which coincides with the 50-day EMA at $77.39.
The Relative Strength Index (RSI) on the daily chart is 34, pointing upward after reaching its oversold conditions, indicating weak but fading bearish momentum and early signs of recovery. For the recovery rally to be sustained, the RSI must move above the neutral 50 level. In addition, the Moving Average Convergence Divergence (MACD) lines are converging, with fading red histogram levels below the zero line, further supporting the potential recovery thesis.
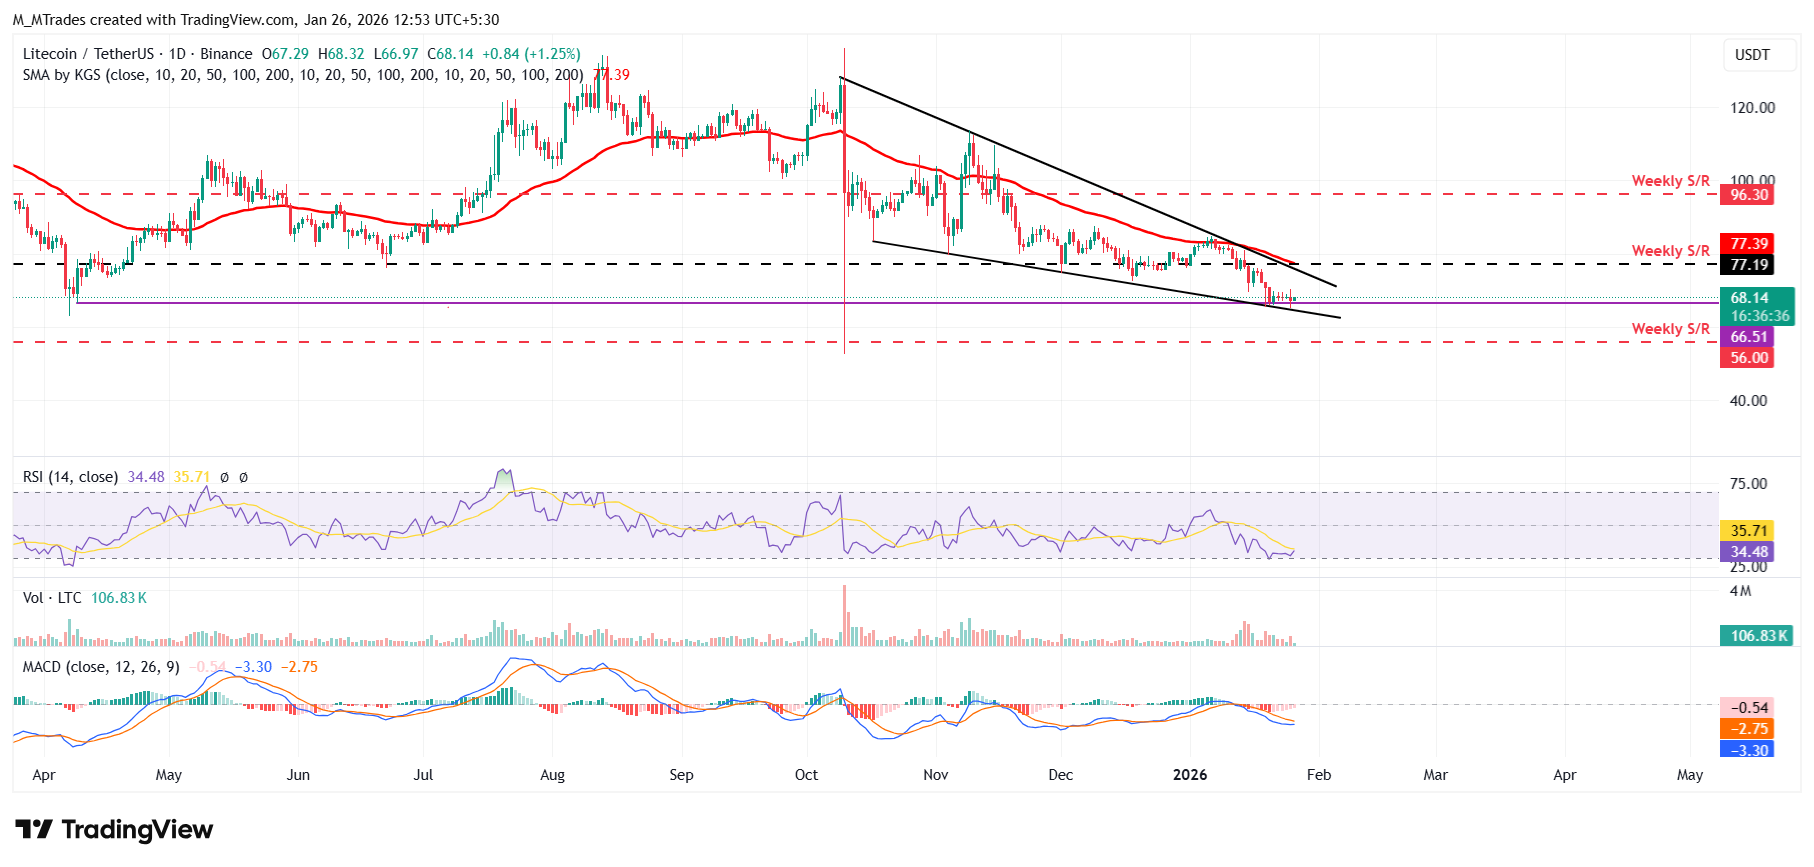
However, if LTC faces a correction, it could extend the decline toward the next weekly support at $56.

100만 명이 넘는 사용자가 FXStreet를 통해 실시간 시장 데이터, 차트 도구, 전문가 인사이트, 포렉스 뉴스를 이용합니다. 포괄적인 경제 캘린더와 교육 웨비나는 트레이더가 정보를 유지하고 신중한 결정을 내리도록 돕습니다. FXStreet는 바르셀로나 본사와 전 세계 지역에 걸쳐 약 60명의 팀으로 구성되어 있습니다.
더 읽기


