
Maple Finance Price Forecast: SYRUP holds firm as AUM reclaims $4 billion
작성자 Vishal Dixit
게시일: 13 Feb 2026 | 수정일: 13 Feb 2026


인기 기사

Maple Finance (SYRUP) is trading near $0.2700 at press time on Friday, with bulls keeping the price buoyant above the S1 Pivot Point support at $0.2497.
- SYRUP hovers above $0.2700 on Friday, hinting at a potential rebound within a larger descending channel pattern.
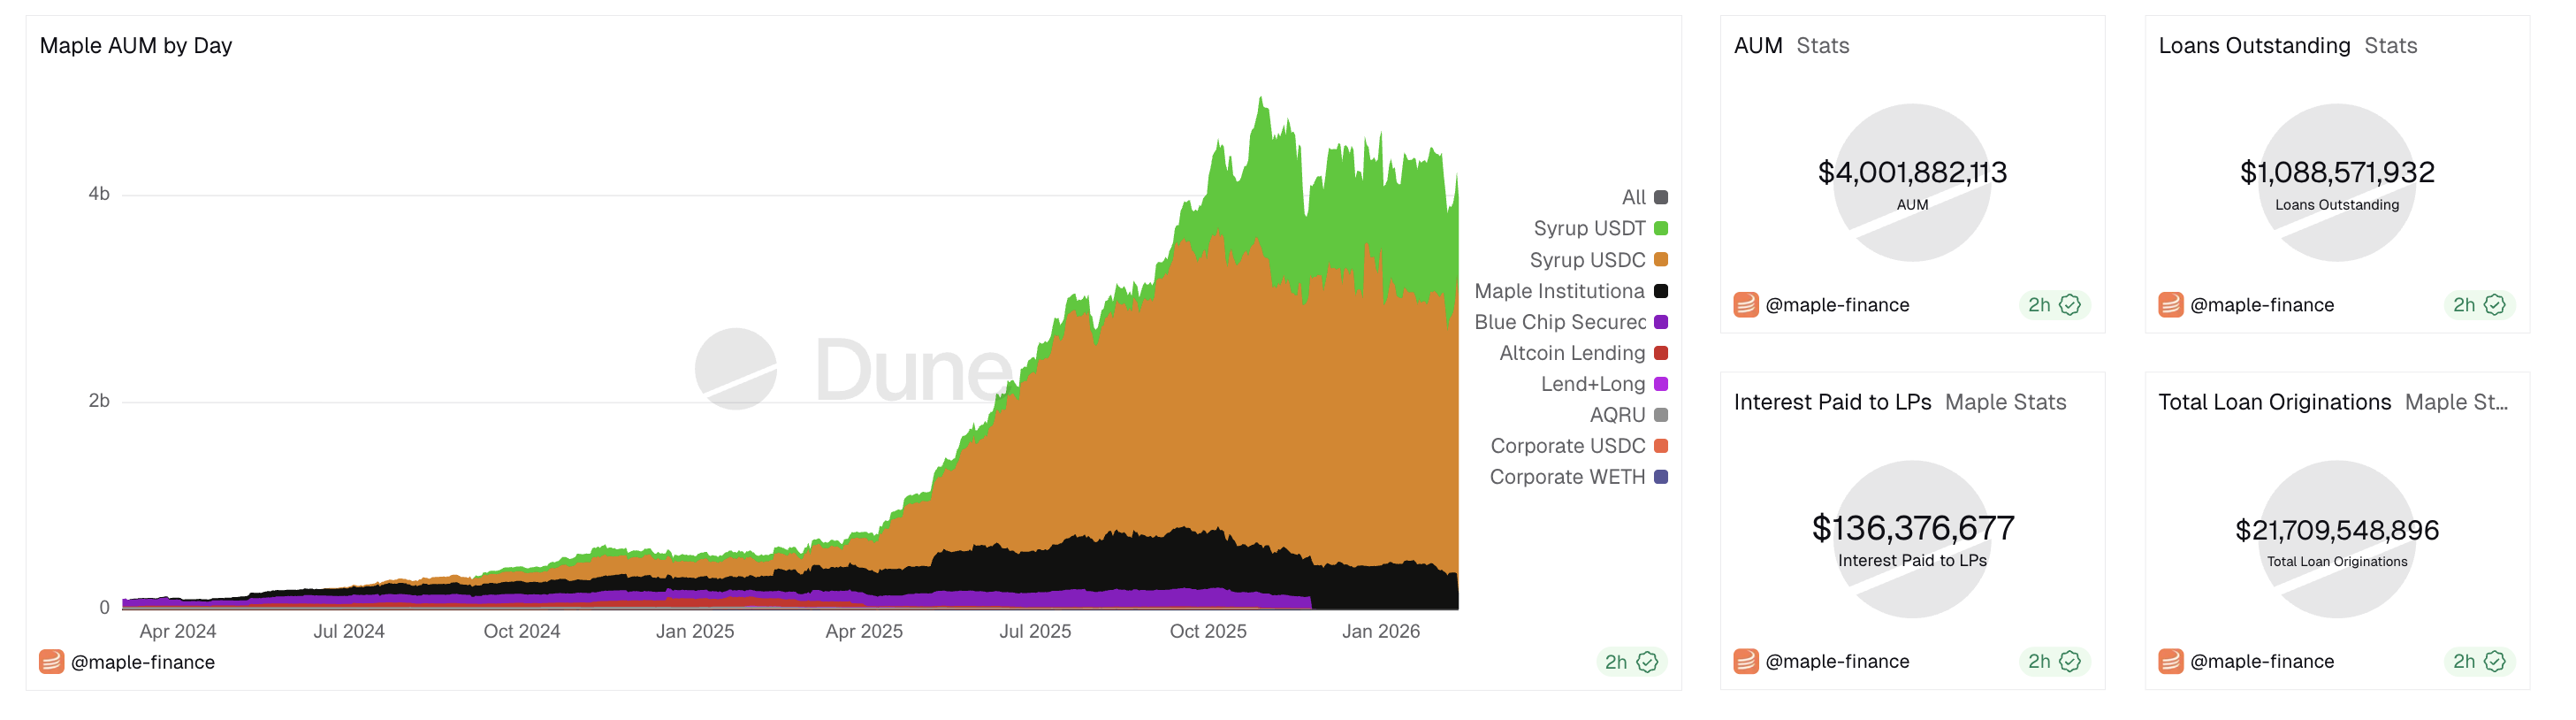
- On-chain data shows that assets under management have risen above $4 billion, with monthly revenue remaining steady.
- The technical outlook for Maple Finance suggests a possible upward shift in trend momentum.
Maple Finance (SYRUP) is trading near $0.2700 at press time on Friday, with bulls keeping the price buoyant above the S1 Pivot Point support at $0.2497. The on-chain data indicate consistent user demand for the Decentralized Finance (DeFi) protocol, with its Assets Under Management (AUM) exceeding $4 billion and revenue remaining steady after reaching a monthly record high in January. The technical outlook for SYRUP indicates a rebound as selling pressure wanes.
Maple Finance retains revenue, whale interest
Dune dashboard data indicate that Maple Finance recorded revenue of $1.46 million so far this month, after reaching a record high of $2.57 million in revenue, primarily from lending fees and yield optimization. This reflects a steady increase in monthly revenues, building on the $2.49 million collected in December.
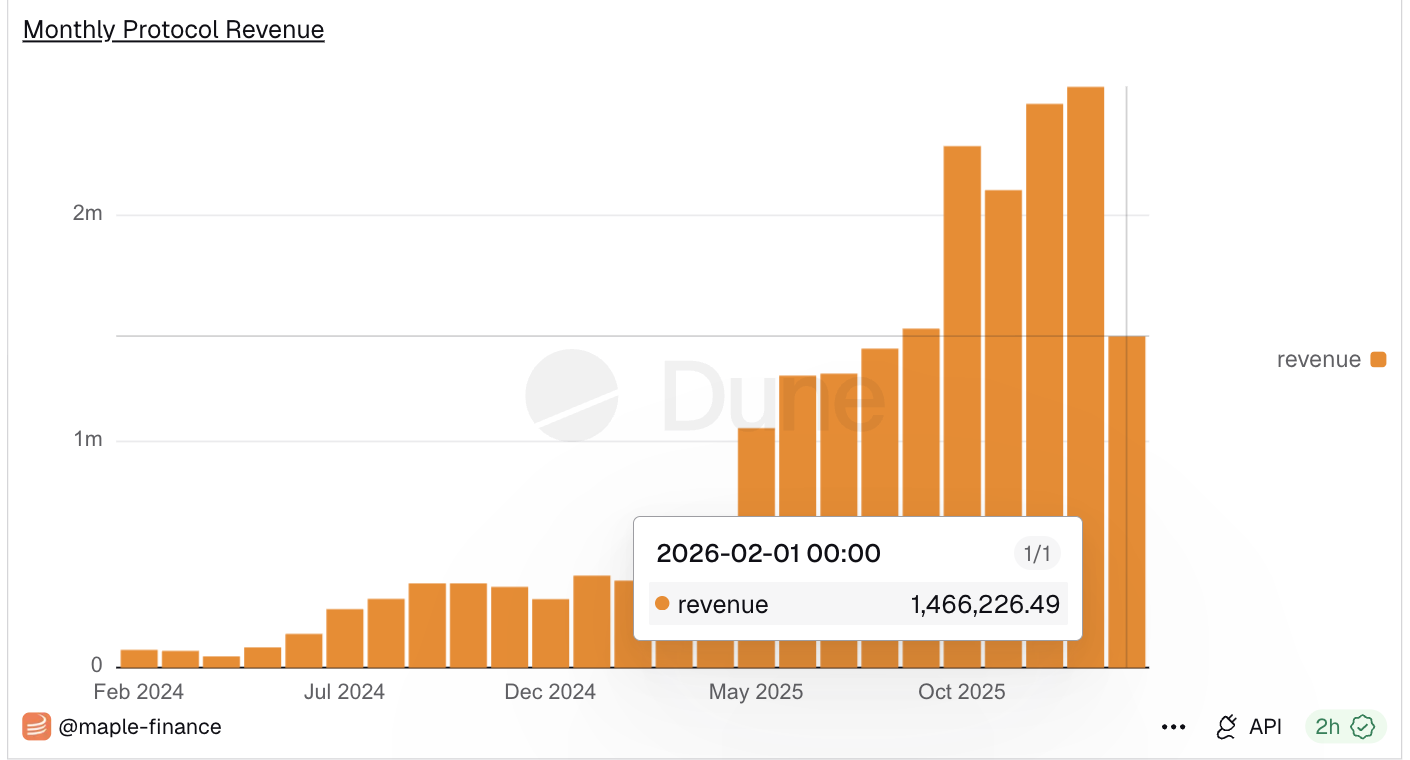
Additionally, the protocol's AUM has exceeded $4 billion, while outstanding loan balances account for $1.08 billion. The steady revenue and rising AUM suggest that Maple Finance's ecosystem continues to expand amid increasing market demand.
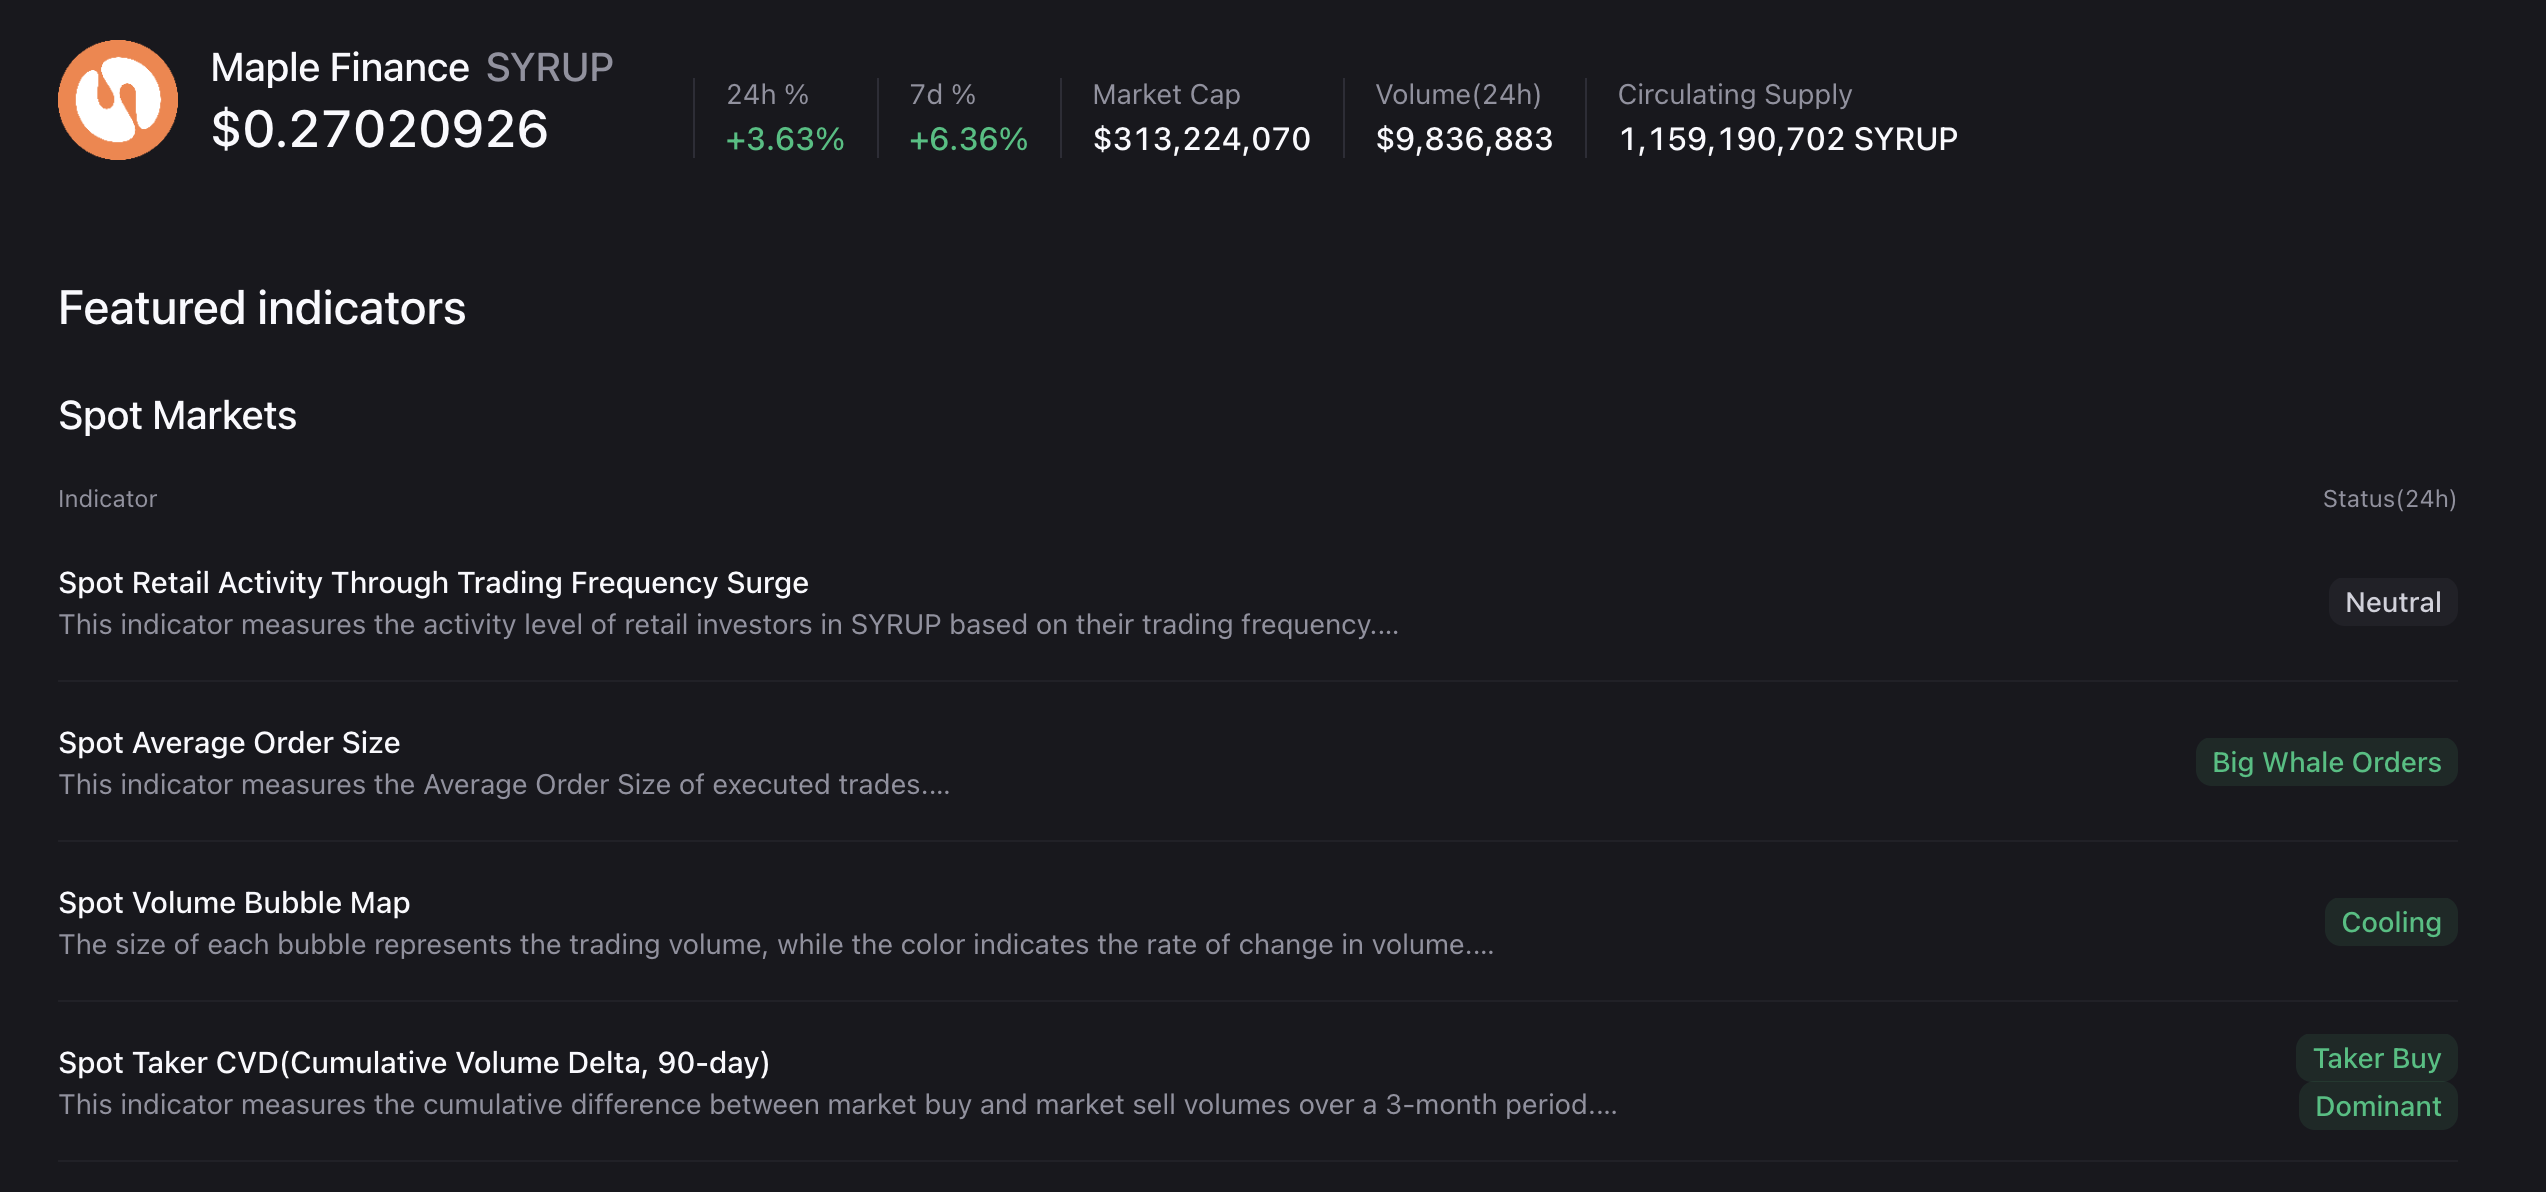
Corroborating the high demand, CryptoQuant data shows consistent interest from large wallet investors, commonly known as whales, based on the average SYRUP order size of executed spot-market trades.
Technical outlook: Will SYRUP rebound within the falling channel?
Maple Finance is above the S1 pivot point at $0.2497, serving as short-term support following a broader decline over the last 31 days, which has resulted in roughly a 35% loss. This decline reflects a downward trend within a larger descending channel pattern formed by two parallel lines on the daily chart.
A potential rebound in SYRUP could test the 50-day Exponential Moving Average (EMA) at $0.3176, followed by the 200-day EMA at $0.3666 near the overhead resistance line.
The technical indicators on the daily chart suggest that selling pressure is waning. The Relative Strength Index (RSI) is at 36, hovering above the oversold zone and taking a lateral shift after the prevailing decline. Additionally, the Moving Average Convergence Divergence (MACD) approaches the signal line as the histogram's negative component contracts, indicating a potential crossover that would confirm a return to bullish momentum.
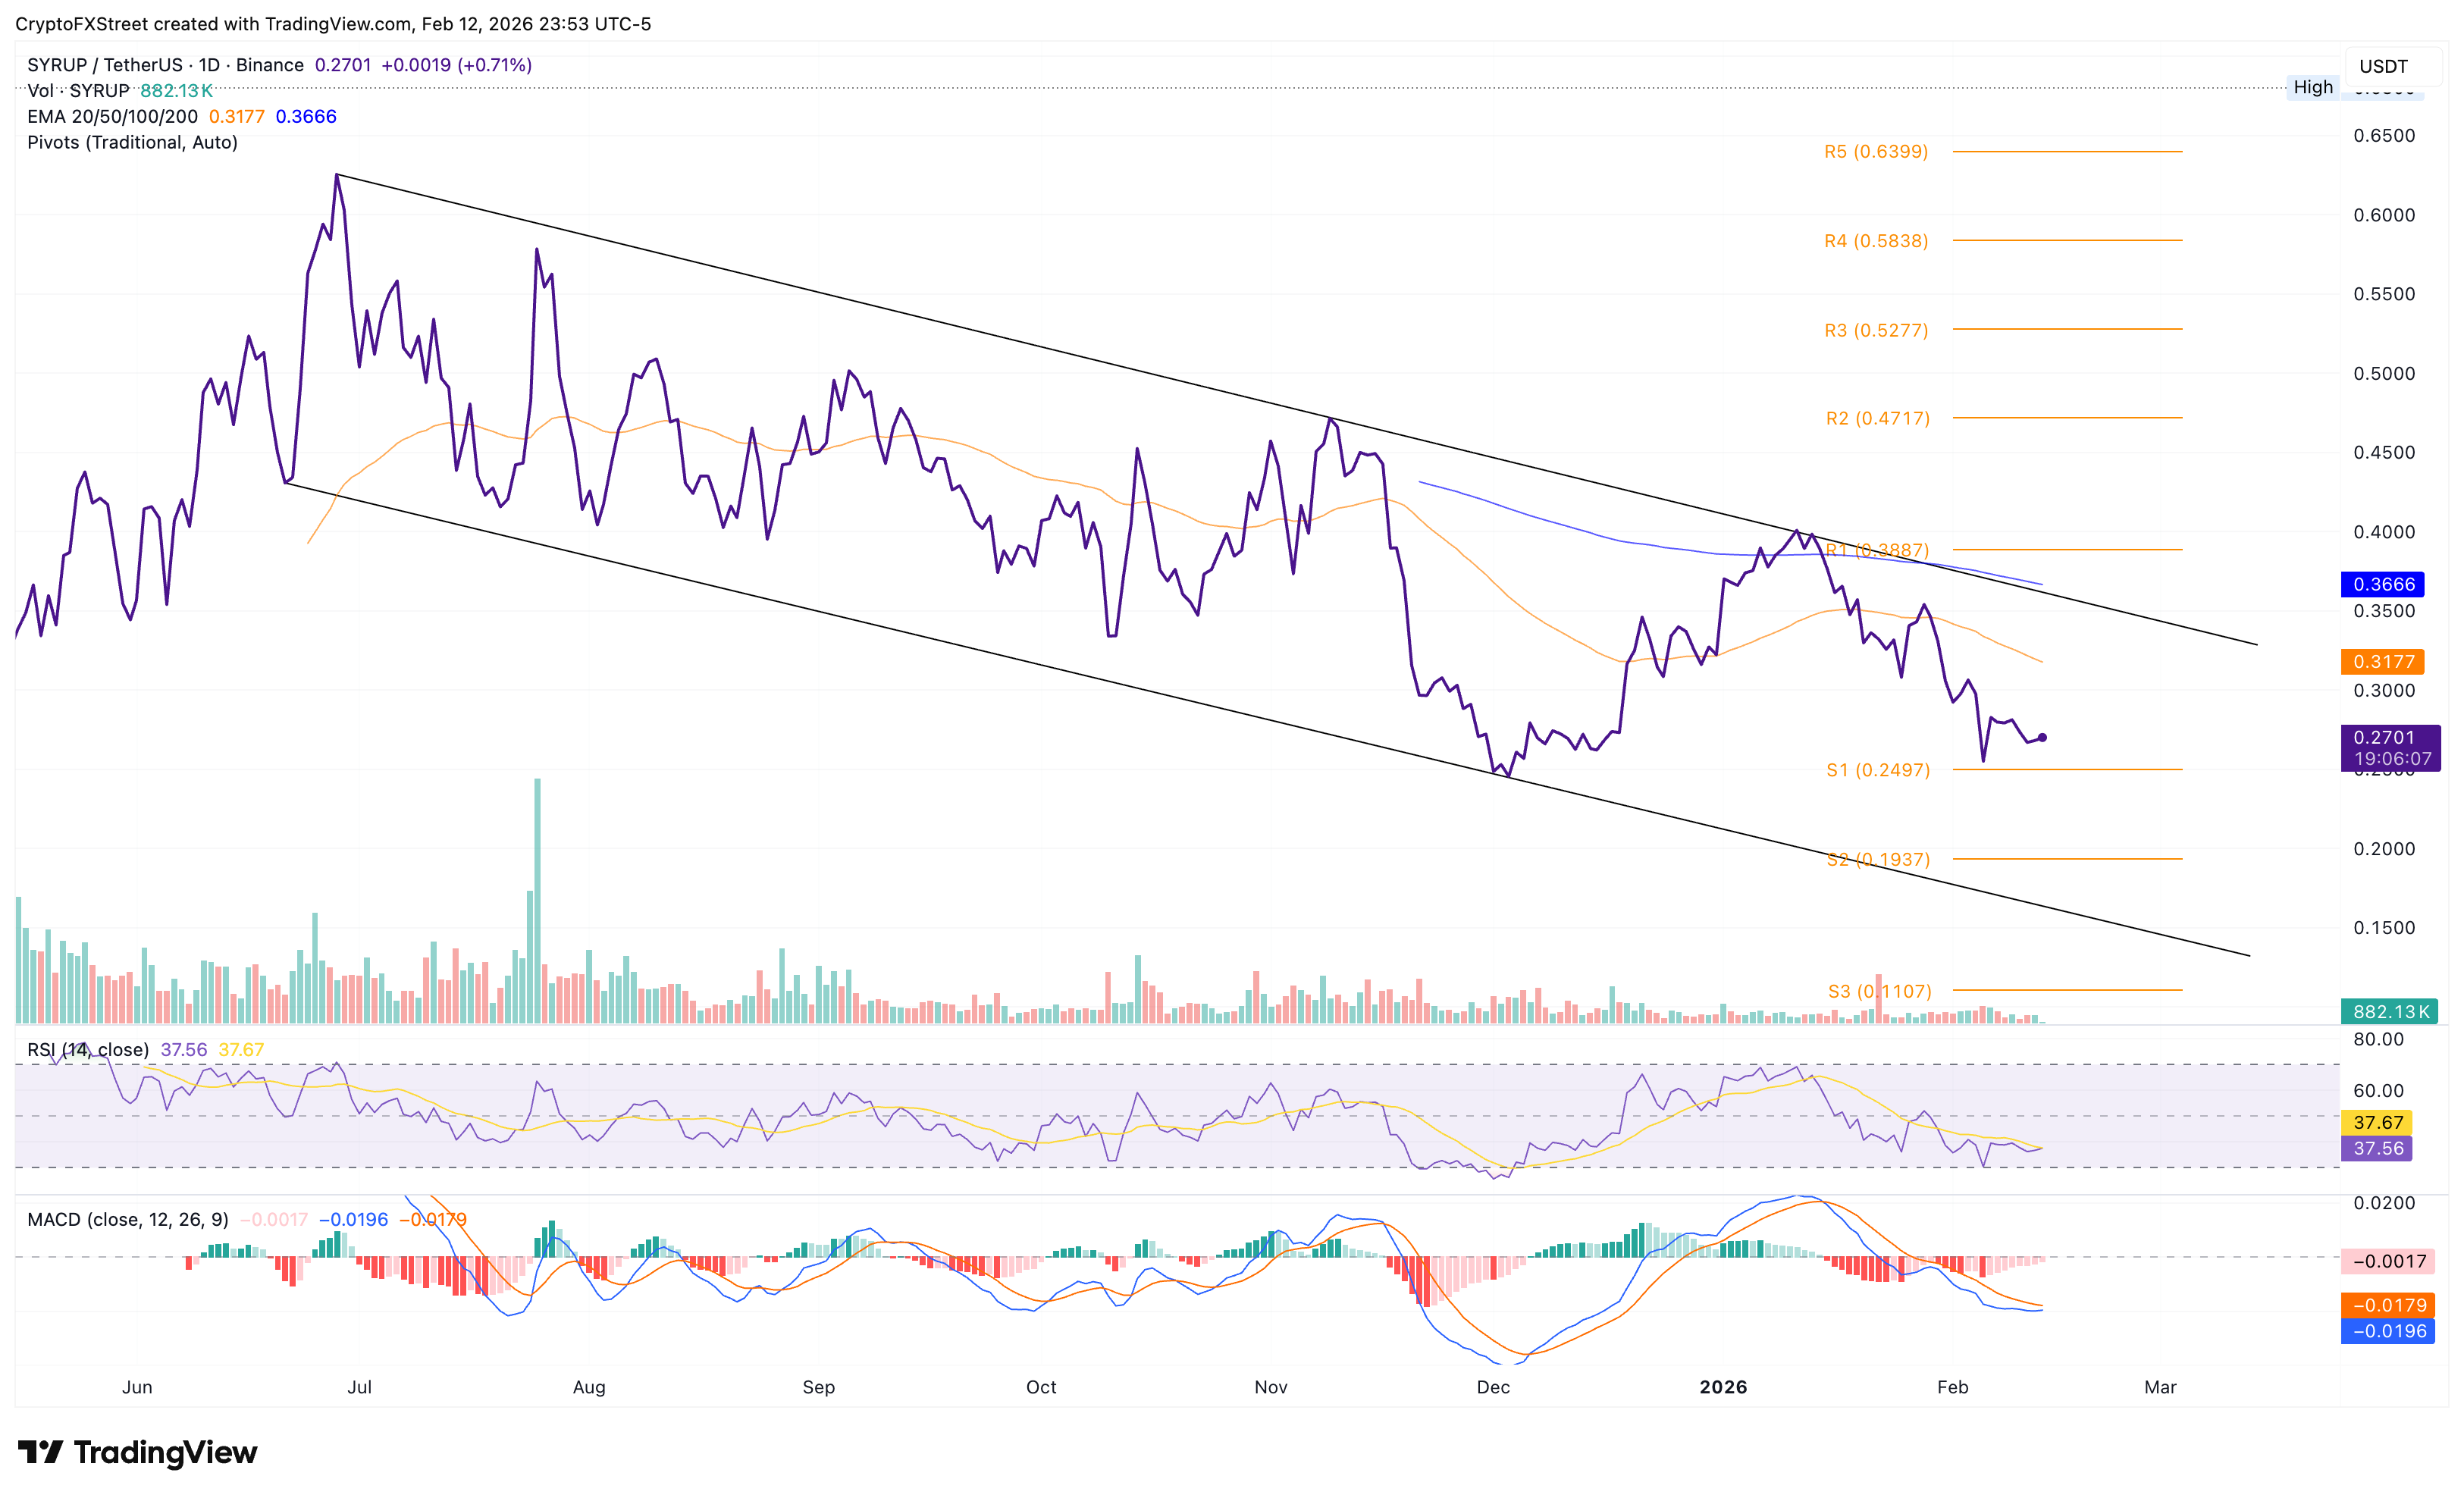
However, if SYRUP closes below the $0.2497, it could extend the decline to the S2 pivot point at $0.1937.

100만 명이 넘는 사용자가 FXStreet를 통해 실시간 시장 데이터, 차트 도구, 전문가 인사이트, 포렉스 뉴스를 이용합니다. 포괄적인 경제 캘린더와 교육 웨비나는 트레이더가 정보를 유지하고 신중한 결정을 내리도록 돕습니다. FXStreet는 바르셀로나 본사와 전 세계 지역에 걸쳐 약 60명의 팀으로 구성되어 있습니다.
더 읽기


