
Meme Coins Price Prediction: DOGE rebounds, SHIB stabilizes, PEPE nears breakout
작성자 Manish Chhetri
수정됨: 21 May 2026


인기 기사

Dogecoin (DOGE), Shiba Inu (SHIB) and Pepe (PEPE) meme coins are extending the recovery on Thursday after recent corrections. DOGE finds support from the key zone, SHIB holds the lower consolidation boundary, while PEPE nears the key resistance zone, with a breakout suggesting further upside.
- Dogecoin extends its rebound on Thursday after finding support near a key support zone earlier this week.
- Shiba Inu recovers from the lower boundary of its consolidation range around $0.000056.
- Pepe approaches its 50-day EMA at $0.0000038, a firm close above suggests further upside.
Dogecoin (DOGE), Shiba Inu (SHIB) and Pepe (PEPE) meme coins are extending the recovery on Thursday after recent corrections. DOGE finds support from the key zone, SHIB holds the lower consolidation boundary, while PEPE nears the key resistance zone, with a breakout suggesting further upside. In addition, improving market sentiment driven by renewed hopes for a potential peace agreement between the US and Iran has also supported the recovery across these meme coins.
Dogecoin rebounds from key support zone
Dogecoin price faced rejection from the weekly resistance at $0.119 last week and declined by over 11% through Tuesday. DOGE retested and found support around the previous trendline breakout level, which coincides with the daily support at $0.102 on Wednesday, and recovered slightly. At the time of writing on Thursday, DOGE is extending the rebound trading above $0.105, nearing the 200-day Exponential Moving Average (EMA) at $0.106.
If DOGE continues its recovery and closes above the 200-day EMA at $0.106 on a daily basis, it could extend the rally toward the weekly resistance at $0.119.
The Relative Strength Index (RSI) on the daily chart reads near 49, suggesting neutral momentum after the recent pullback, while the Moving Average Convergence Divergence (MACD) remains in negative territory, hinting that upside attempts could struggle while these higher EMAs cap the advance.
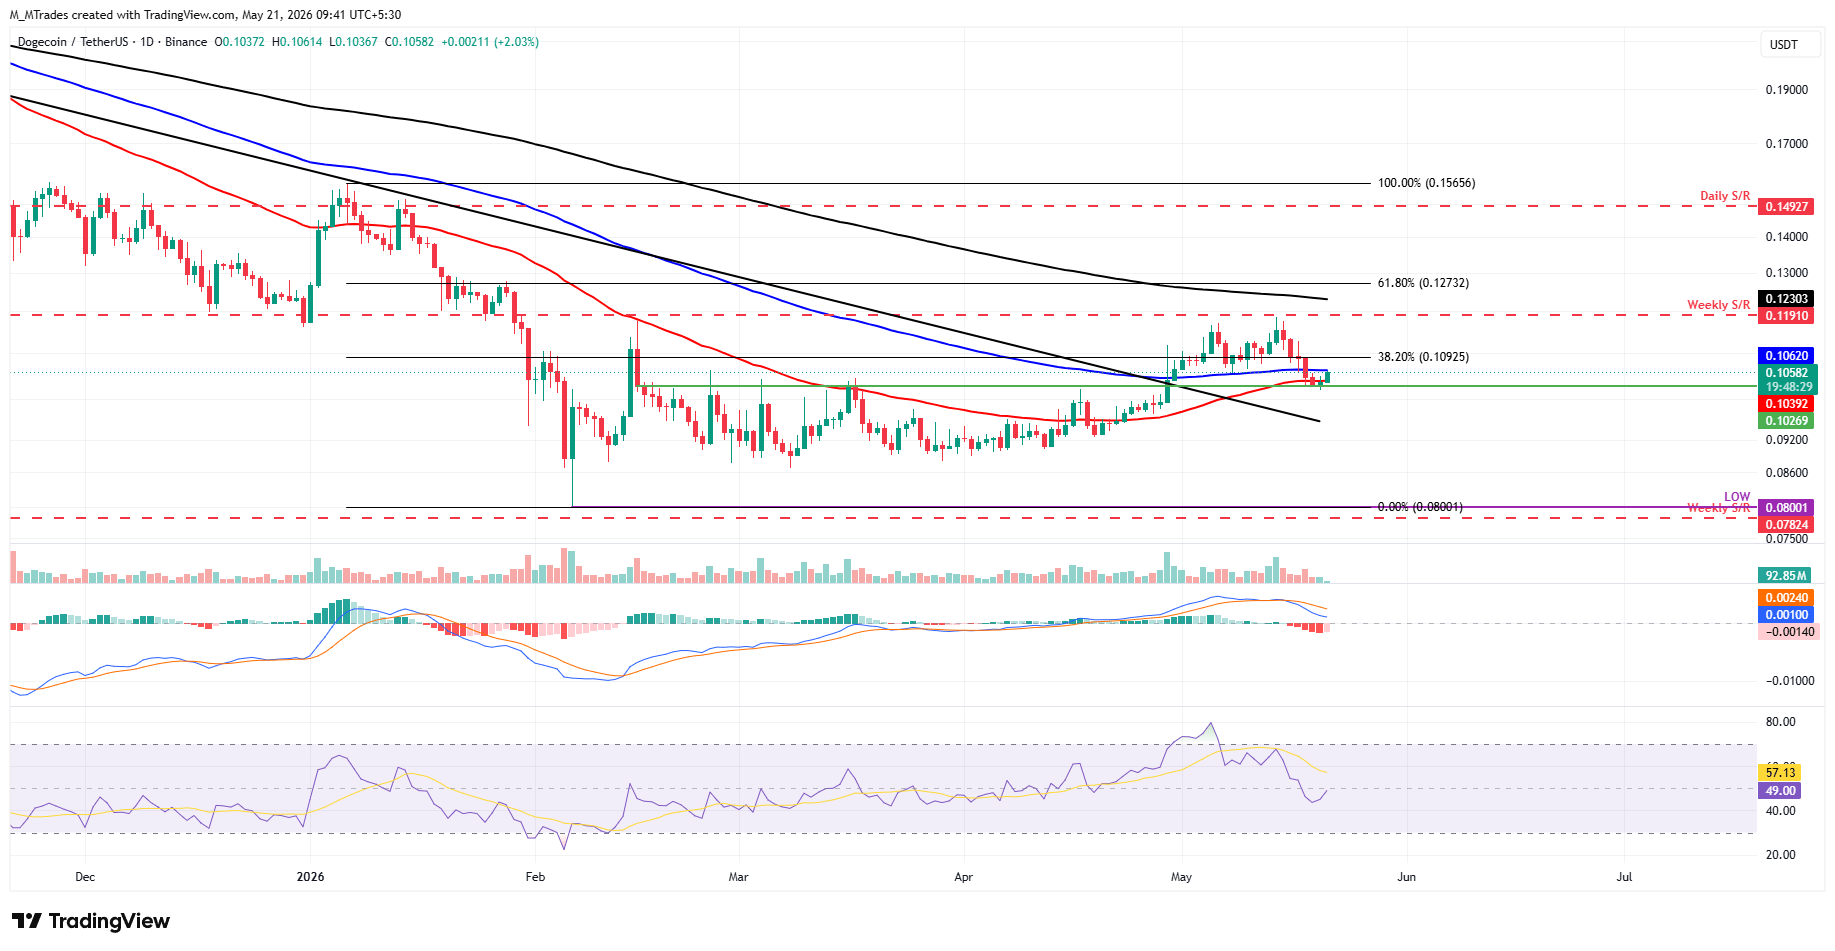
However, if DOGE corrects and closes below the daily support at $0.102, it could extend the fall toward the key psychological support at $0.100.
Shiba Inu's lower consolidation boundary holds strong
Shiba Inu price retested the lower boundary of the consolidation range at $0.0000056 on Tuesday and recovered nearly 2% the next day. At the time of writing on Thursday, SHIB is extending its rebound above $0.0000058.
If SHIB continues its recovery, it could extend the advance toward the mid-point of the consolidation zone near $0.0000059. A daily close above this level could extend gains toward the 50-day EMA at $0.0000061.
The RSI on the daily chart is 41, pointing upward toward the neutral level and showing early signs of fading bearish momentum. However, the MACD indicator remains in negative territory, hinting that upside attempts could struggle.
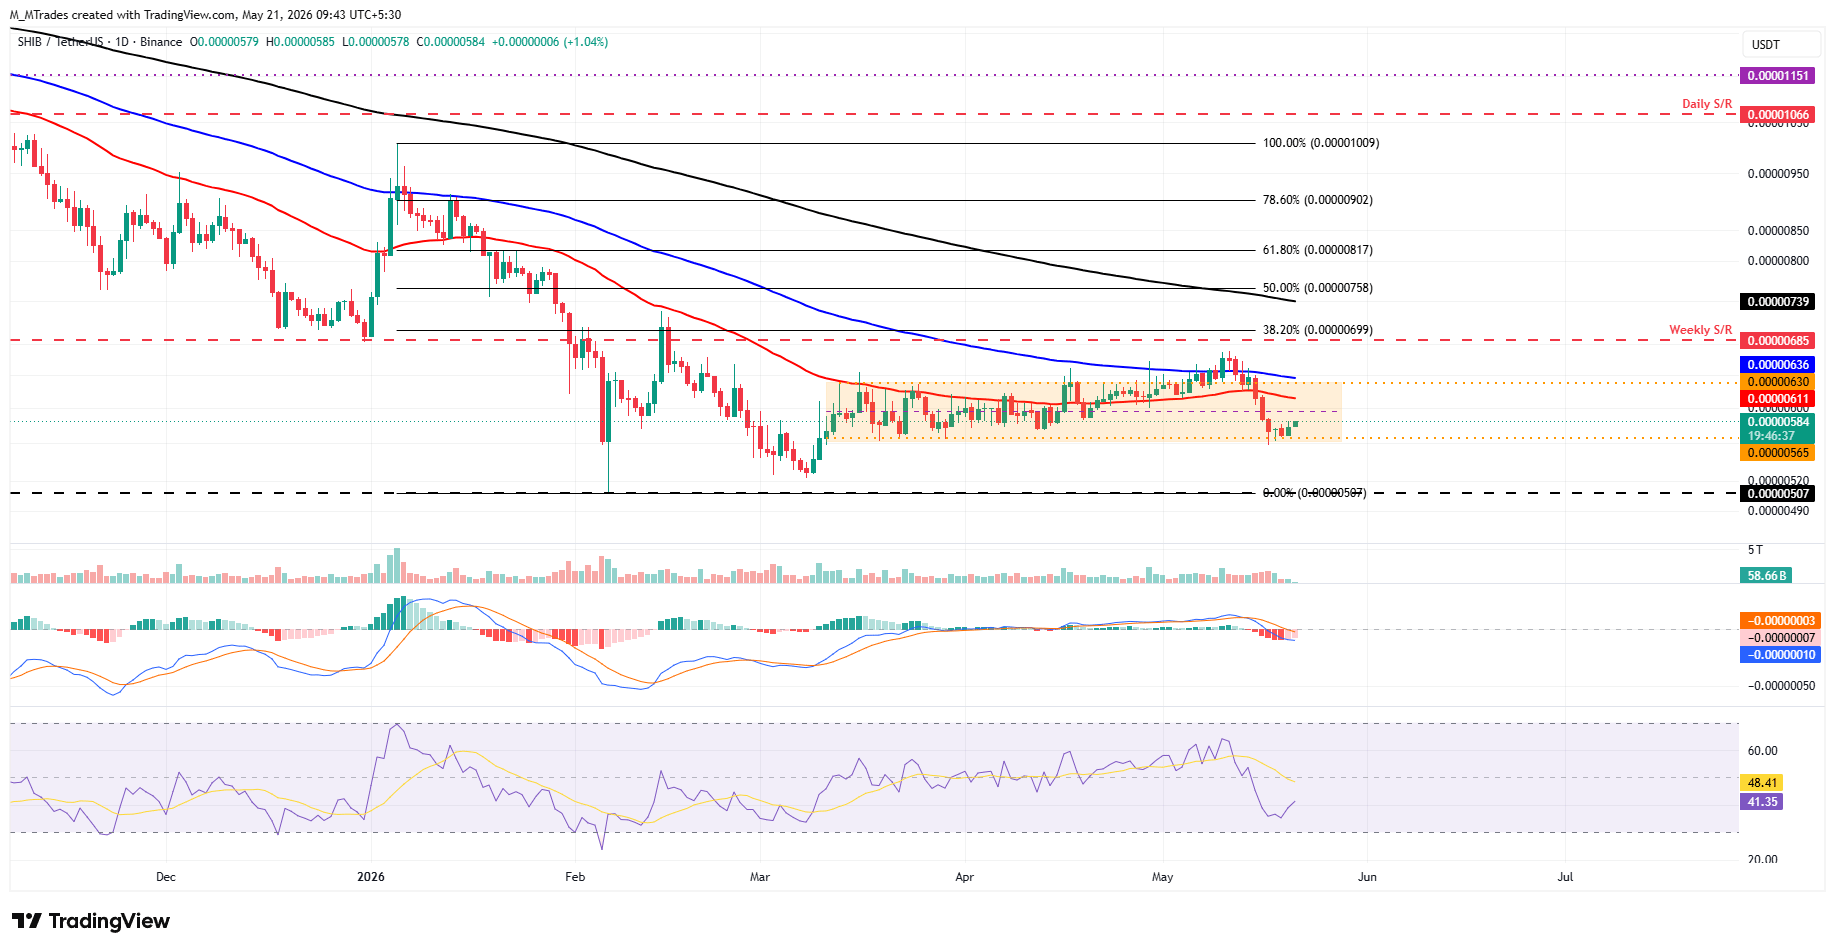
However, if SHIB faces a pullback, it could extend the loss toward the lower boundary of the consolidation range at $0.0000056. A daily close below this level could extend the correction toward the February 6 low at $0.0000050.
Pepe could extend the rally if it closes above the 50-day EMA
Pepe price found support at the daily support level at $0.0000035 on Sunday and recovered slightly through Wednesday. At the time of writing on Thursday, PEPE continues its recovery, trading above $0.0000037.
If PEPE closes above the 50-day EMA at $0.0000038, it could extend the gains toward the 200-day EMA at $0.0000040.
Like DOGE, PEPE’s RSI shows fading bearish strength while MACD still hints at a negative outlook.
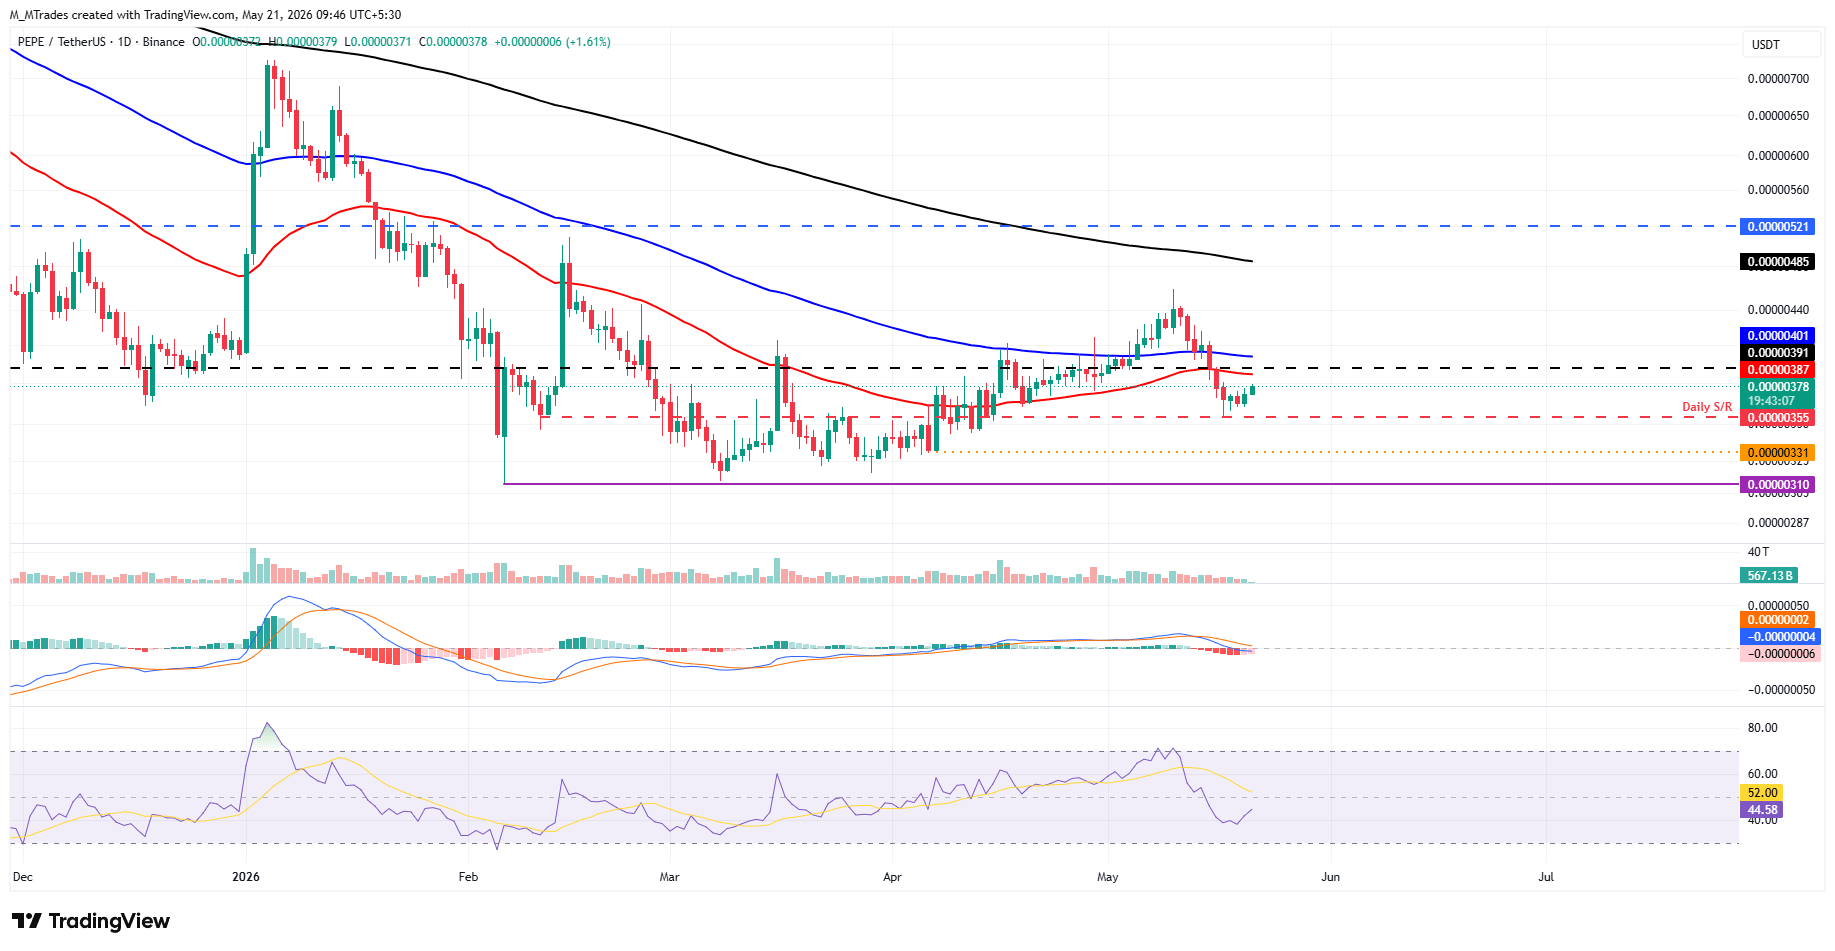
On the other hand, if PEPE corrects, it could extend the losses toward the daily support at $0.0000035.

100만 명이 넘는 사용자가 FXStreet를 통해 실시간 시장 데이터, 차트 도구, 전문가 인사이트, 포렉스 뉴스를 이용합니다. 포괄적인 경제 캘린더와 교육 웨비나는 트레이더가 정보를 유지하고 신중한 결정을 내리도록 돕습니다. FXStreet는 바르셀로나 본사와 전 세계 지역에 걸쳐 약 60명의 팀으로 구성되어 있습니다.
더 읽기


