
Meme Coins Price Prediction: Dogecoin, Shiba Inu, Pepe at risk of falling further as social interest wanes
작성자 Vishal Dixit
게시일: 23 Mar 2026 | 수정일: 23 Mar 2026


인기 기사

Meme coins, including Dogecoin (DOGE), Shiba Inu (SHIB), and Pepe (PEPE), are under intense selling pressure as the tensions in the Middle East weigh down on the broader cryptocurrency market. Data shows that social metrics for meme coins are falling as investor sentiment turns fearful.
- Dogecoin trades below $0.090 on Monday, extending its rejection of the 50-day EMA amid rising selling pressure.
- Shiba Inu approaches the previous week’s low at 0.00000562 as buying pressure wanes.
- Pepe edges lower on Monday, extending its six-day losing streak and the 5% fall from last week.
Meme coins, including Dogecoin (DOGE), Shiba Inu (SHIB), and Pepe (PEPE), are under intense selling pressure as the tensions in the Middle East weigh down on the broader cryptocurrency market. Data shows that social metrics for meme coins are falling as investor sentiment turns fearful. However, the technical outlook for DOGE, SHIB, and PEPE highlights immediate key support levels that could limit near-term losses.
Bullish sentiment falter for meme coins
Investor demand for meme coins wanes amid the broader crypto market correction, as these tokens are driven by sentiment and community. Santiment data shows that the social dominance and volume of meme coins maintain a broadly downward trend so far this year, standing at 0.81% and 402, respectively, on Sunday.
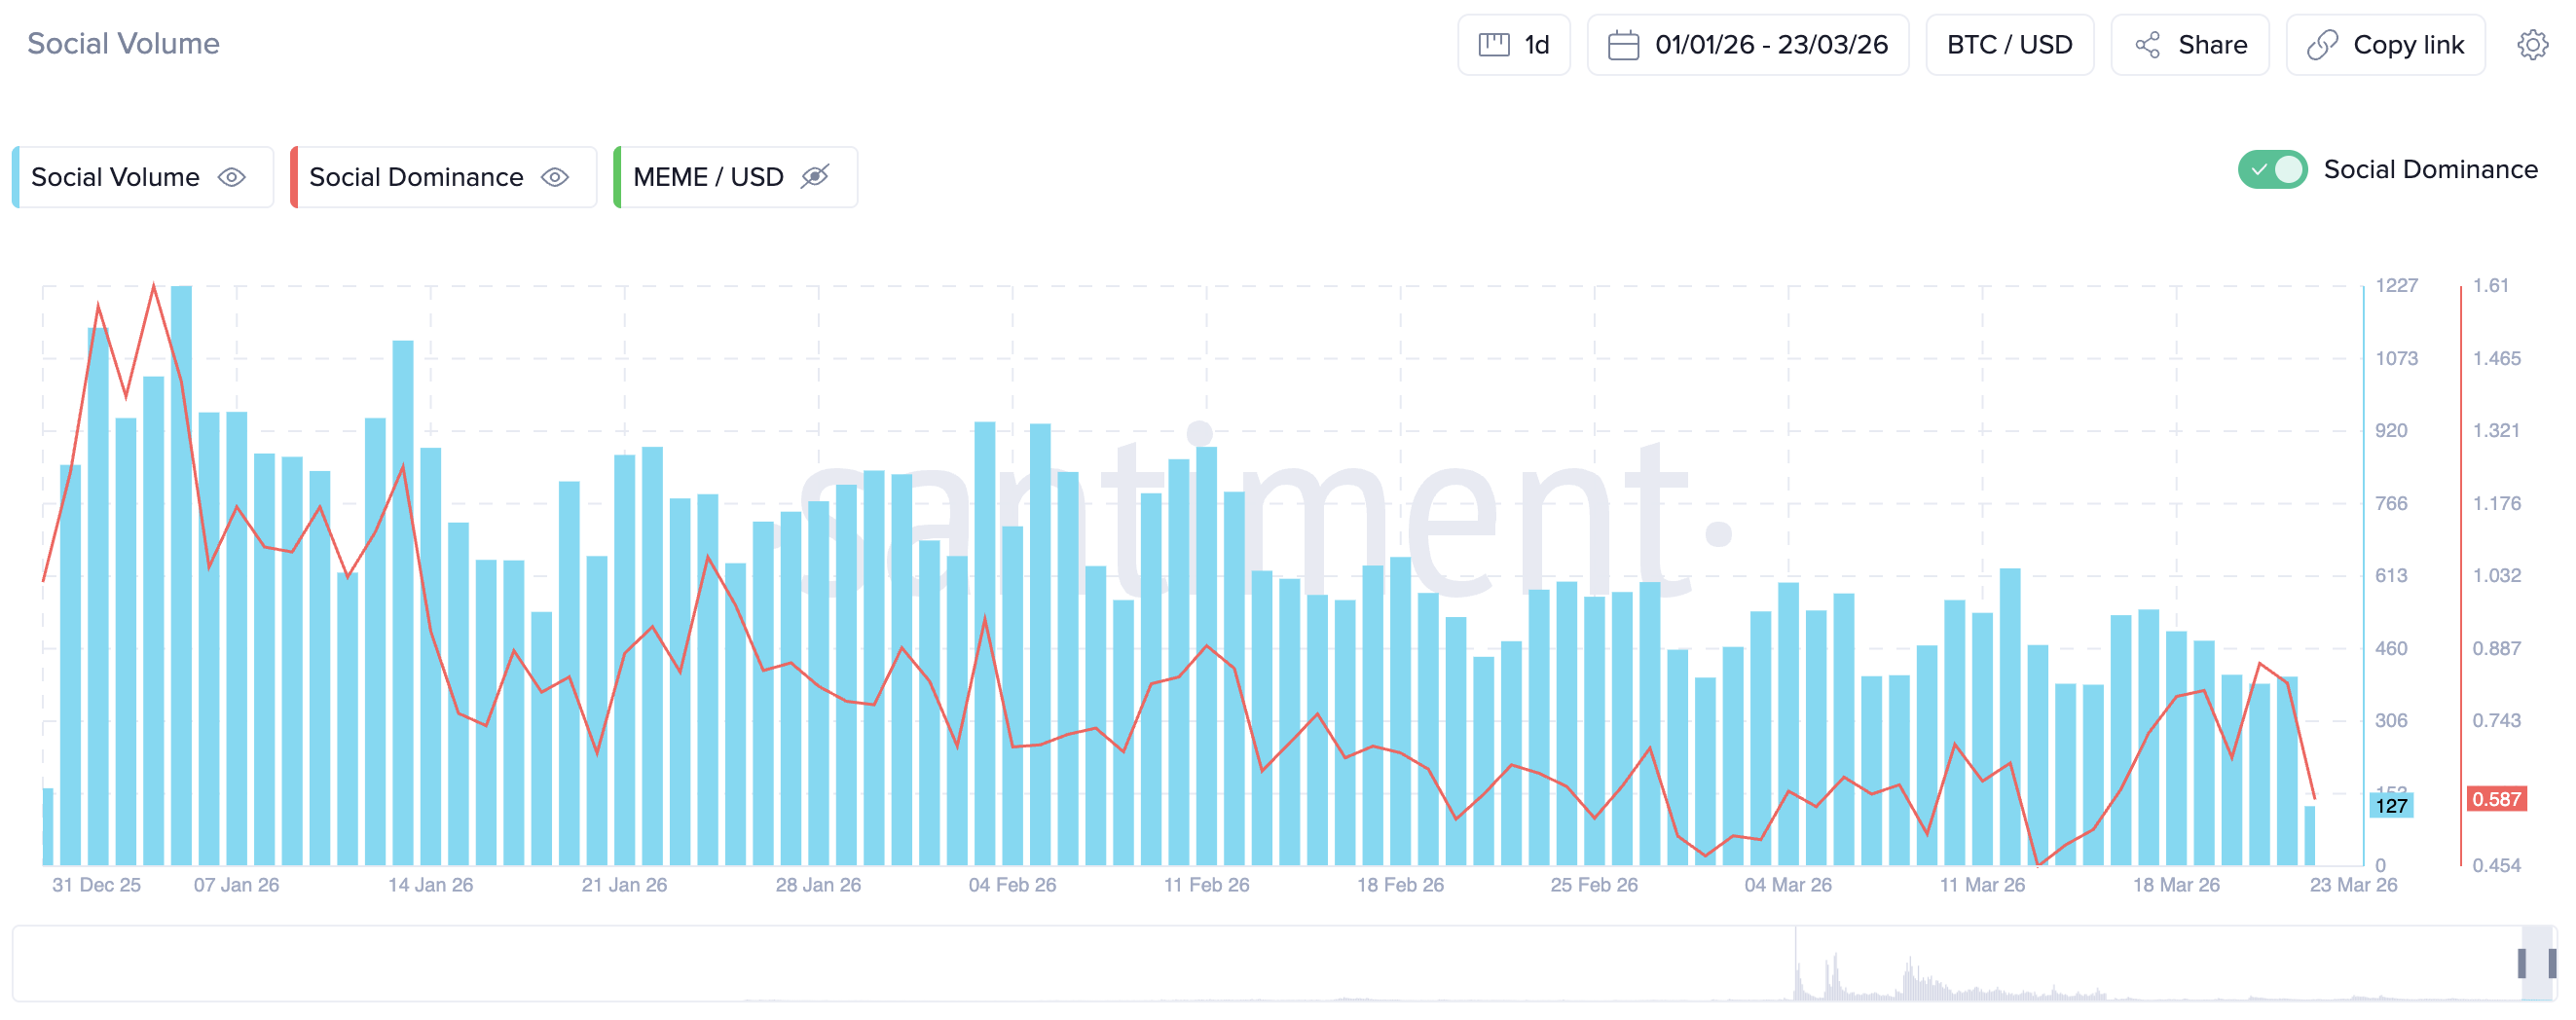
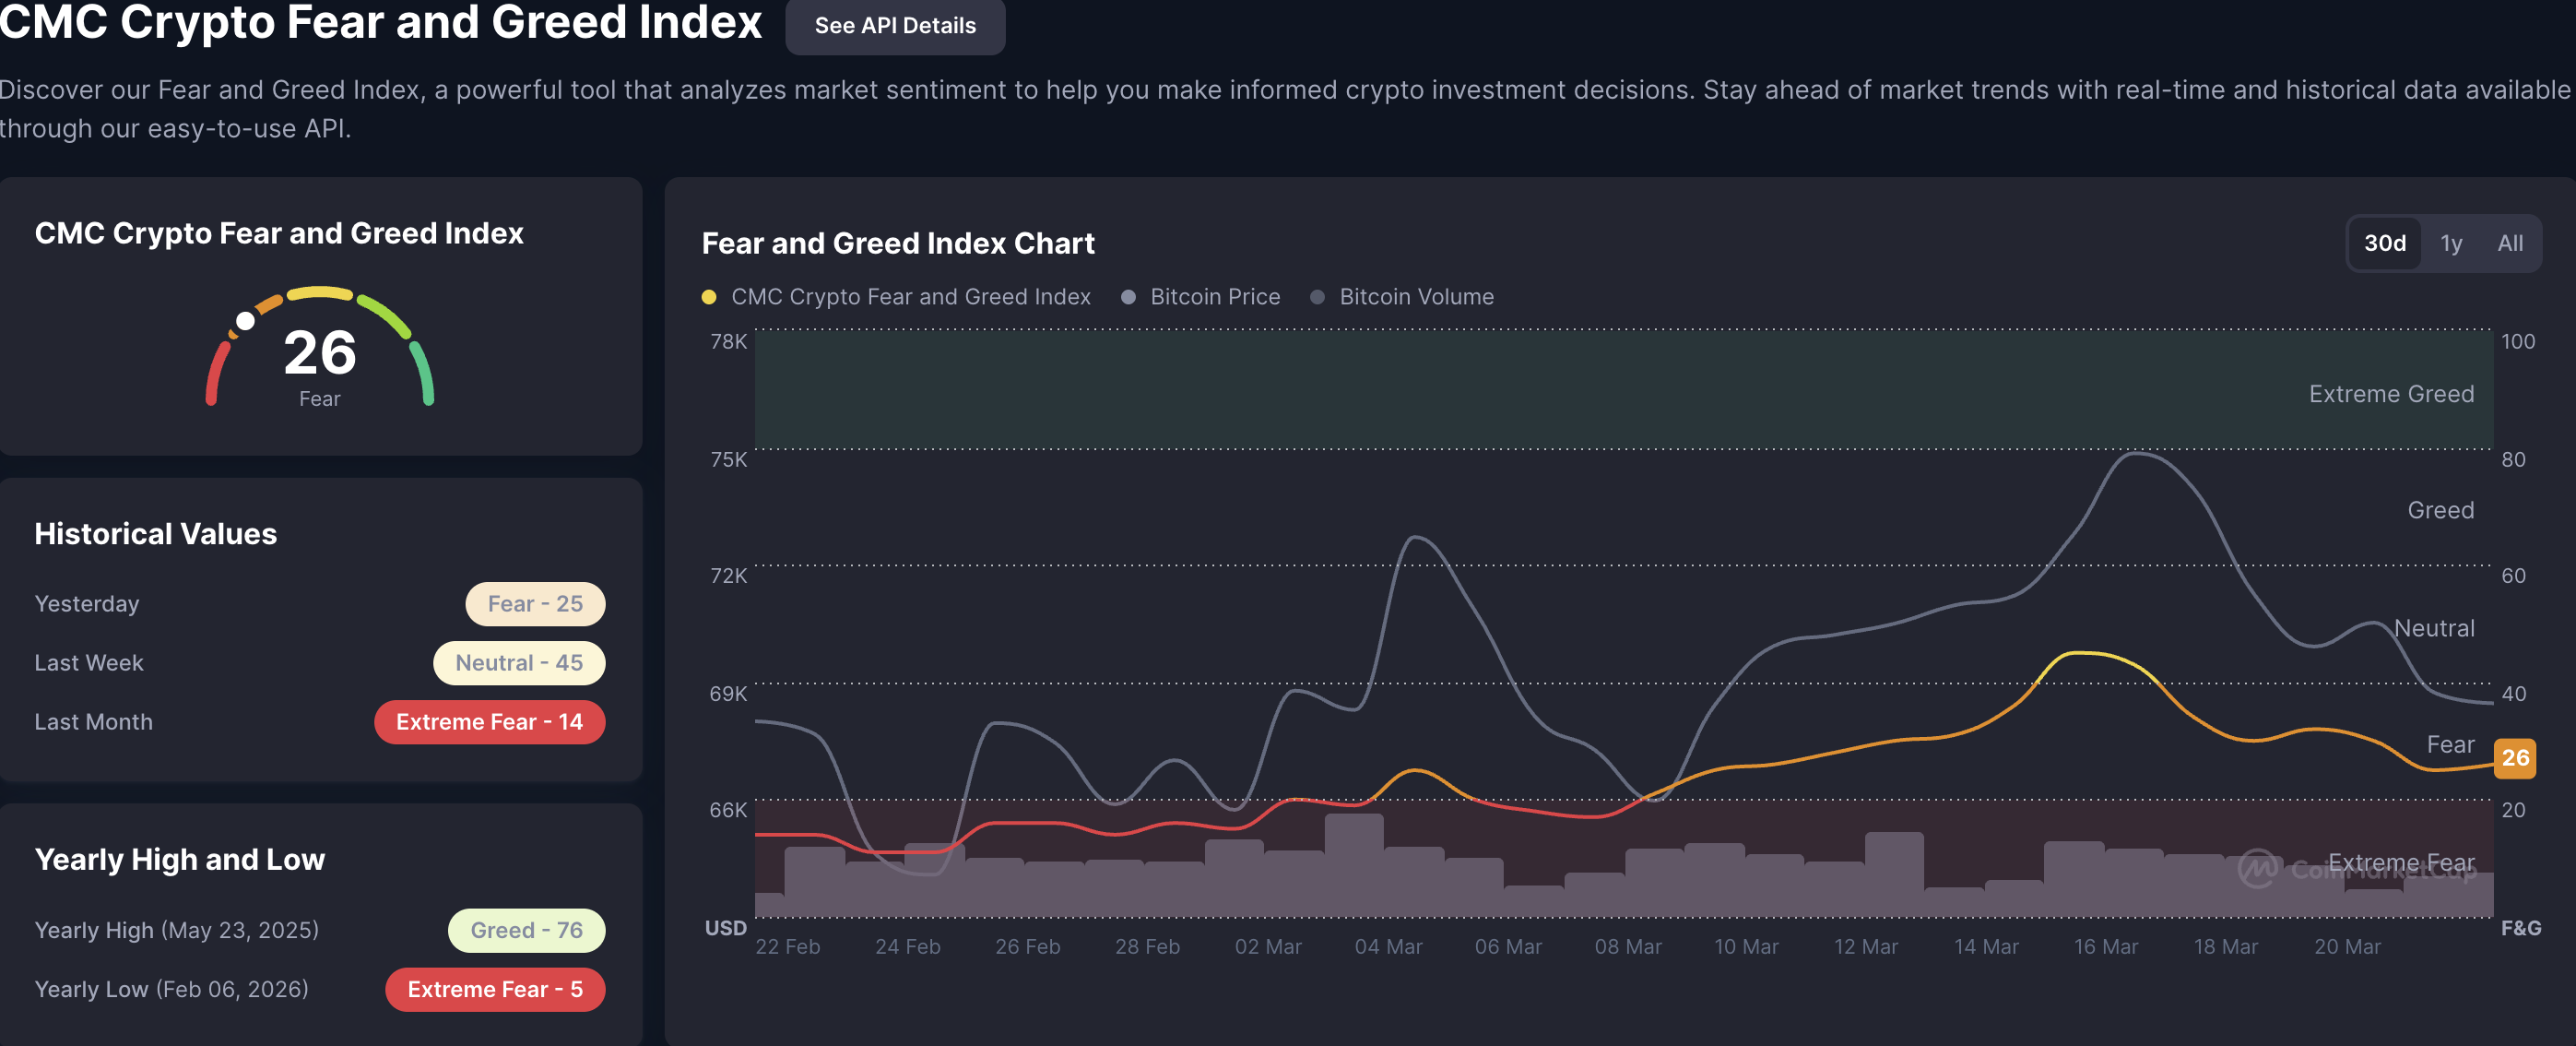
The waning buzz around meme coins aligns with the deterioration of the broader market sentiment. CoinMarketCap’s Fear and Greed Index at 26 signals fear among investors, after a rejection from the neutral region at 45 on March 16.
If the broader market sentiment fails to recover, the meme coins could threaten the immediate support zone, leading to further losses.
Technical analysis of meme coins: DOGE, SHIB, and PEPE approach key support zones
Dogecoin is trading below $0.0900 at the time of writing on Monday, after two consecutive days of losses. The near-term bias stays bearish as DOGE holds below the 50-, 100-, and 200-day Exponential Moving Averages (EMAs), keeping the meme coin locked under a broader descending context.
Initial support for Dogecoin is at the February 11 low at $0.0879, which guards the downside to the February 6 low at $0.0800.
The Moving Average Convergence Divergence (MACD) indicator has slipped marginally below the signal line on the daily chart, with both lines now reversing in the negative territory, suggesting renewed bearish momentum. The Relative Strength Index (RSI) at 42 slides below the midline, reinforcing a soft bearish tone with further room on the downside before reaching the oversold condition.
Immediate resistance emerges at the 50-day EMA at $0.1000, which previously capped rebounds. A daily close above this barrier would open the way toward the 100-day EMA at $0.1148.
Shiba Inu edges higher at press time on Monday, after two consecutive days of losses. The meme coin holds ground above the previous week’s low at $0.00000562, capping downside risk to the February 6 low at $0.00000507.
The MACD and signal line are approaching each other on the daily chart, risking a bearish crossover, which would confirm a shift in trend momentum. The RSI at 47 hovers below the midline, indicating a mild increase in selling pressure.
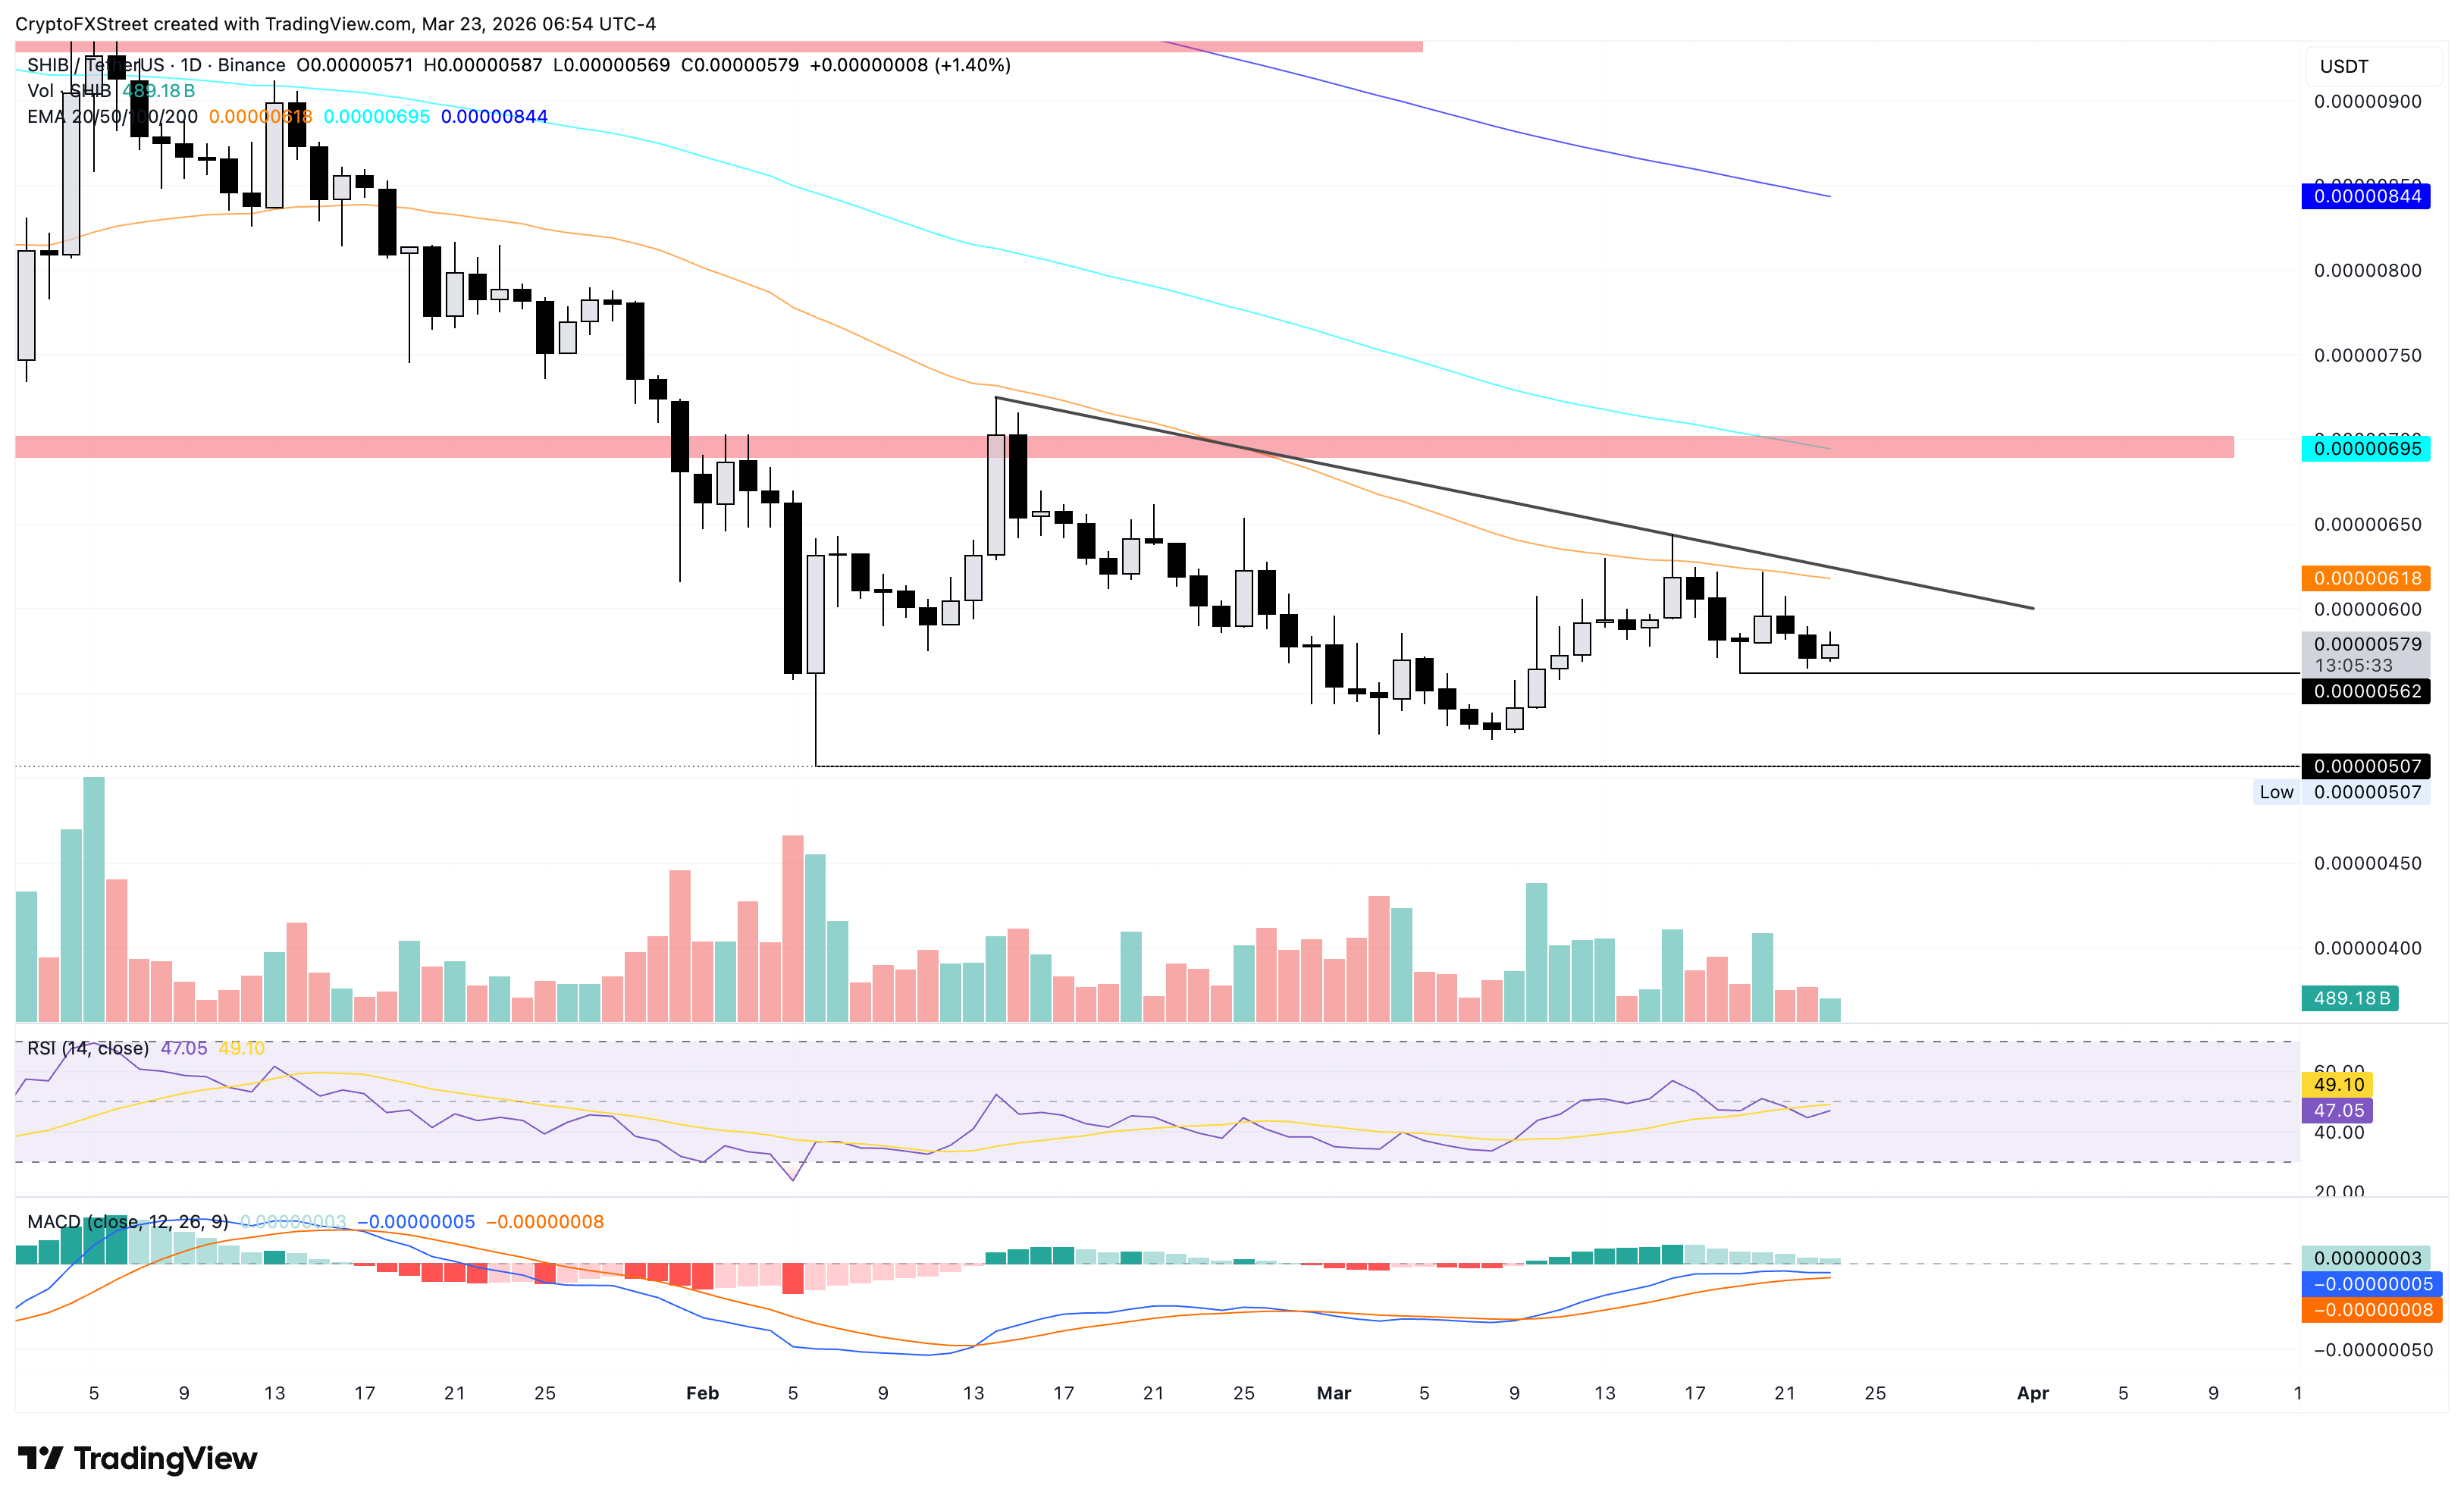
For a renewed recovery, SHIB should secure a daily close above the declining 50-day EMA at $0.00000618, close to a short-term resistance trendline. A breakout above this level would pave the way toward the $0.00000700 supply zone.
Meanwhile, Pepe shows seven consecutive days of decline, mirroring the pullback in Dogecoin. At the time of writing, the frog-themed meme coin is steadily declining toward the $0.00000310 support level, marked by the February 6 low.
PEPE remains below all three crucial daily EMAs on the daily chart, and the MACD converges with its signal line below the midline, reinforcing the lack of clear buying pressure. The RSI at 40 underscores a slight bearish tilt in momentum but stops short of oversold conditions, keeping directional conviction limited.
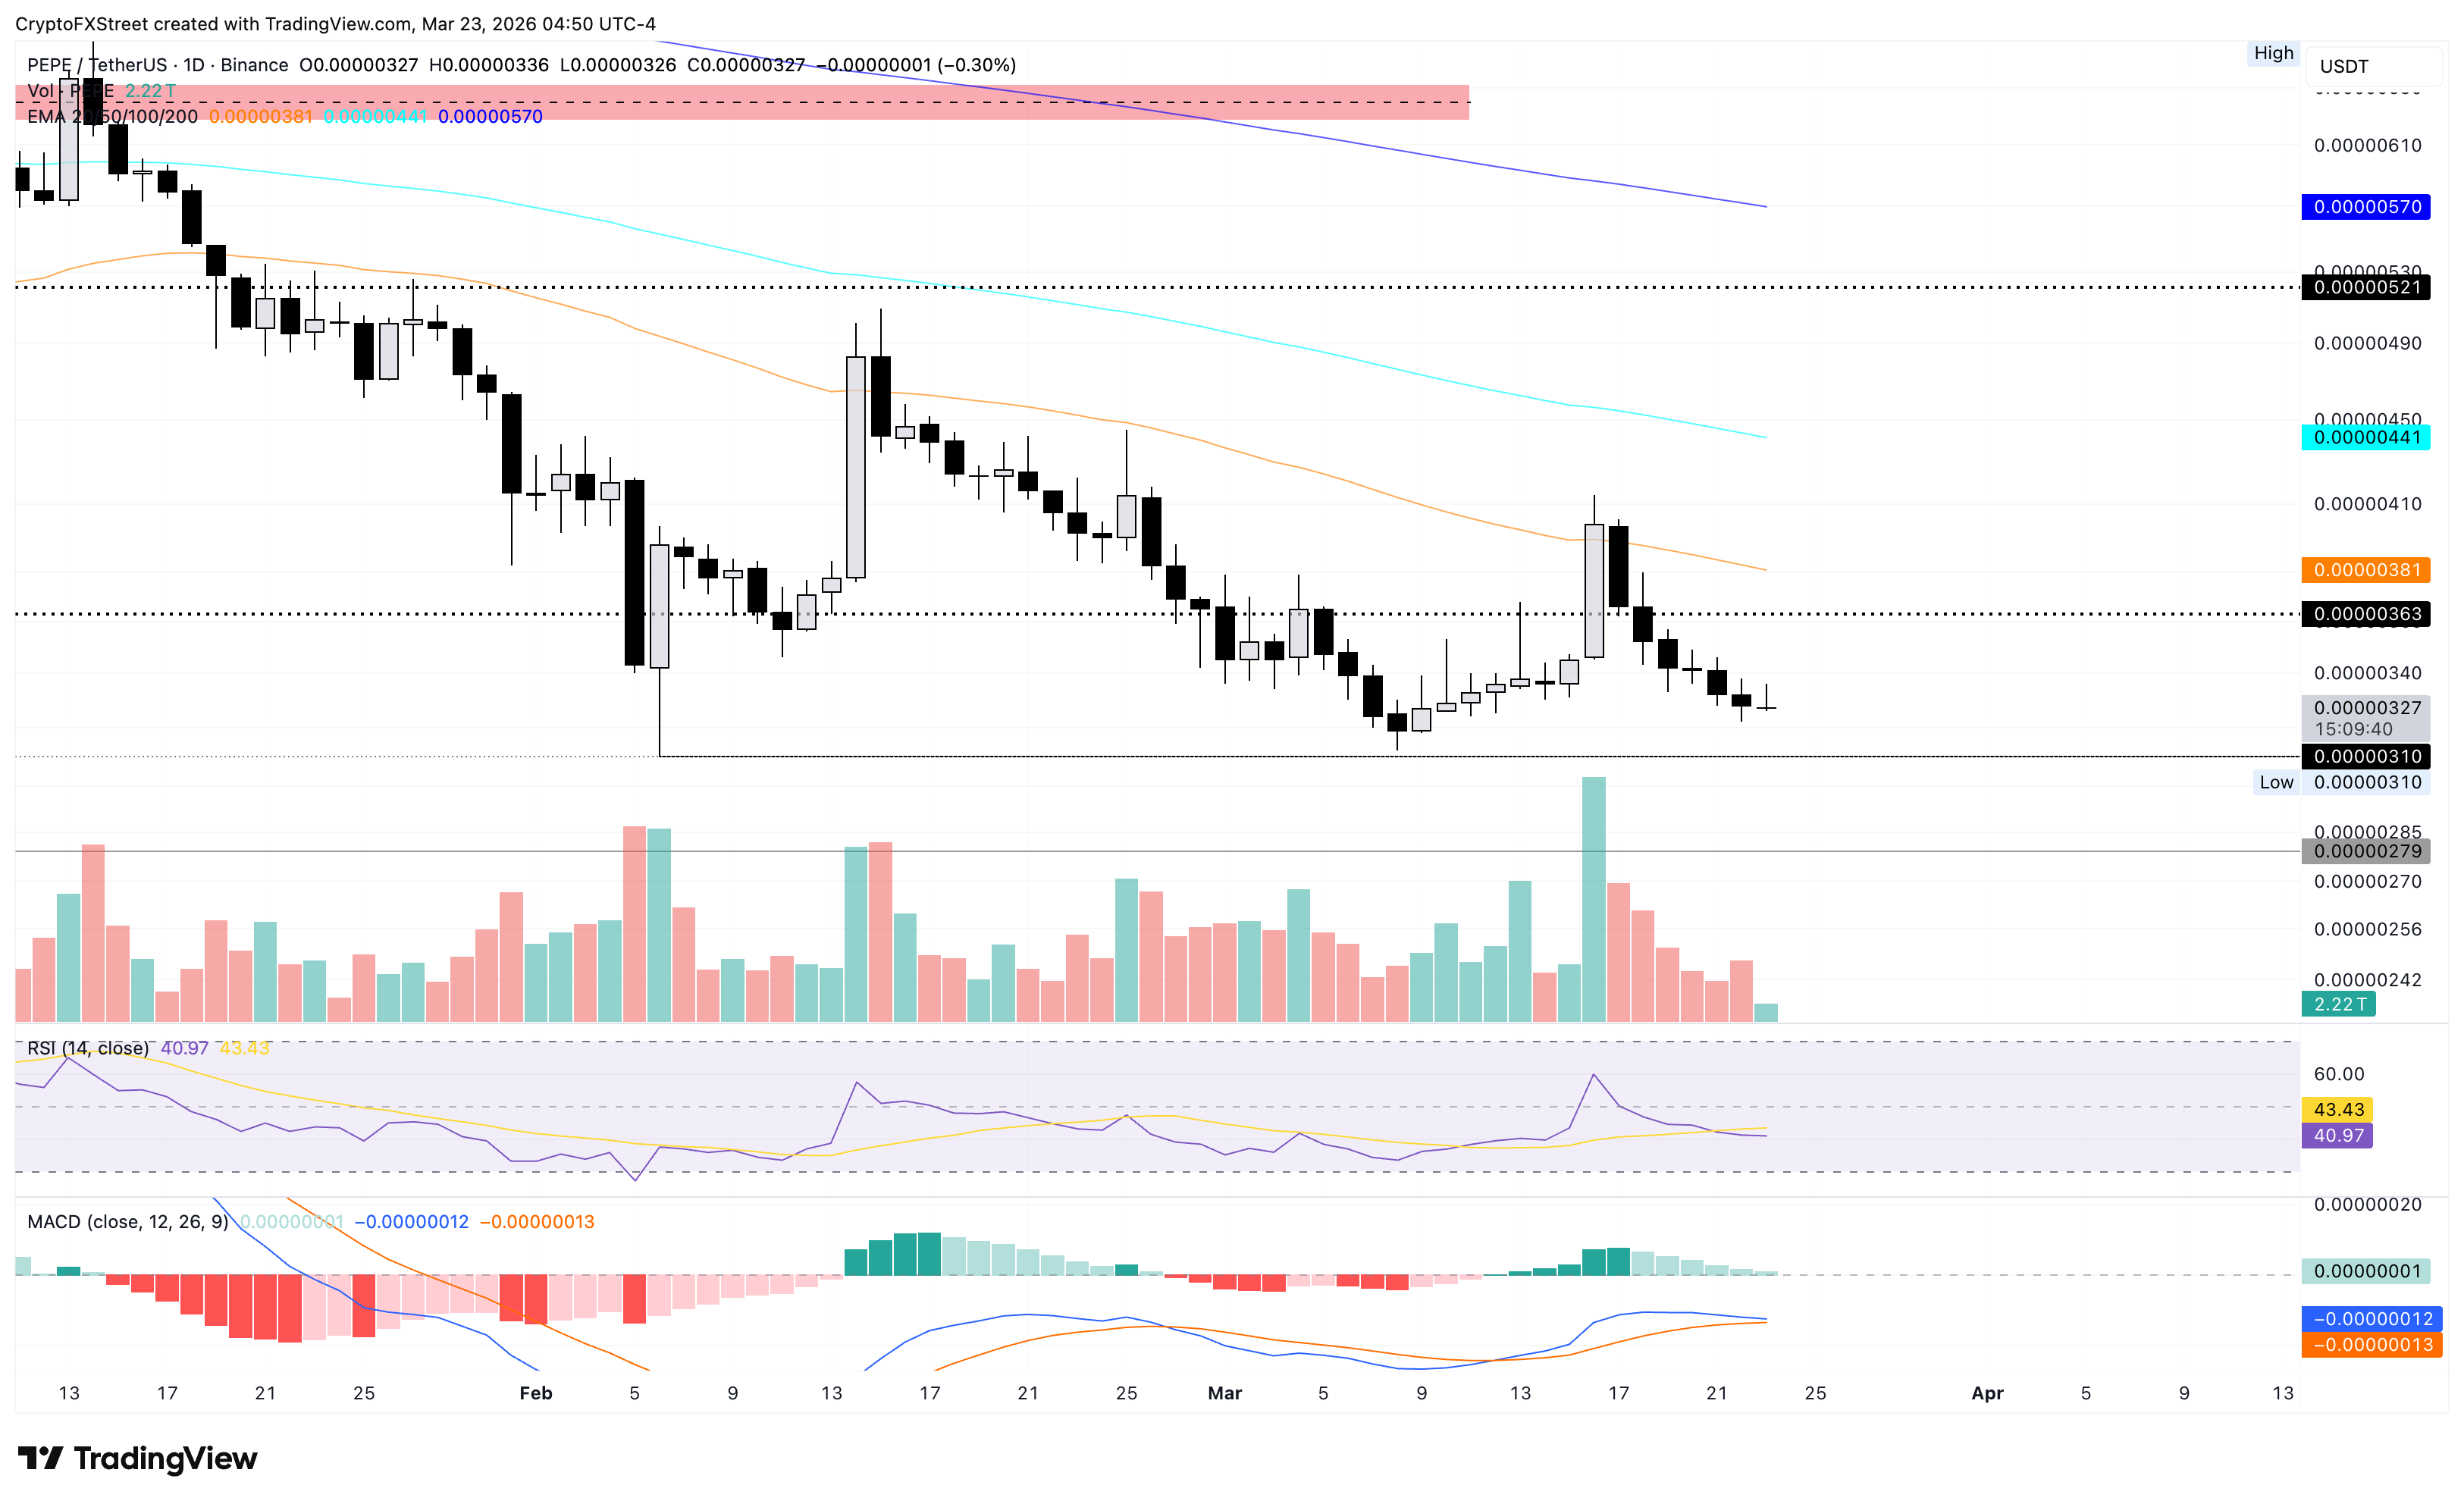
On the topside, any rebound in PEPE should surpass the 50-day EMA at $0.00000381 for a sustained upward trend, which could target the 100-day EMA at $0.00000441.
(The technical analysis of this story was written with the help of an AI tool.)

100만 명이 넘는 사용자가 FXStreet를 통해 실시간 시장 데이터, 차트 도구, 전문가 인사이트, 포렉스 뉴스를 이용합니다. 포괄적인 경제 캘린더와 교육 웨비나는 트레이더가 정보를 유지하고 신중한 결정을 내리도록 돕습니다. FXStreet는 바르셀로나 본사와 전 세계 지역에 걸쳐 약 60명의 팀으로 구성되어 있습니다.
더 읽기


