
Meme Coins Price Prediction: Dogecoin, Shiba Inu, Pepe face downside risks
작성자 Vishal Dixit
게시일: 23 Jan 2026 | 수정일: 23 Jan 2026


인기 기사

Meme coins, including Dogecoin (DOGE), Shiba Inu (SHIB), and Pepe (PEPE), are dragging on Friday amid the broader decline, risking further downside. The technical outlook for the meme coins remains bearish after a losing week.
- Dogecoin consolidates above $0.1200 after losing over 4% so far this week.
- Shiba Inu hovers near a crucial support level as selling pressure eases.
- Pepe flashes downside risk below a crucial psychological support after a 4% drop on Thursday.
Meme coins, including Dogecoin (DOGE), Shiba Inu (SHIB), and Pepe (PEPE), are dragging on Friday amid the broader decline, risking further downside. The technical outlook for the meme coins remains bearish after a losing week.
Dogecoin drags after its downfall
Dogecoin is up nearly 1% at press time on Friday, consolidating above $0.1200 after a drop of over 4% so far this week. The meme coin trades below the declining 50-day and 200-day Exponential Moving Averages (EMAs), reinforcing the bearish bias.
If DOGE slips below the $0.1161 support marked by the December 31 low, it would risk further downside toward the October 10 low at $0.0950.
The technical indicators on the daily chart corroborate the downside bias, as the Relative Strength Index (RSI) at 40 remains below the midline, and the Moving Average Convergence Divergence (MACD) sustains the sell signal and crosses below the zero line.
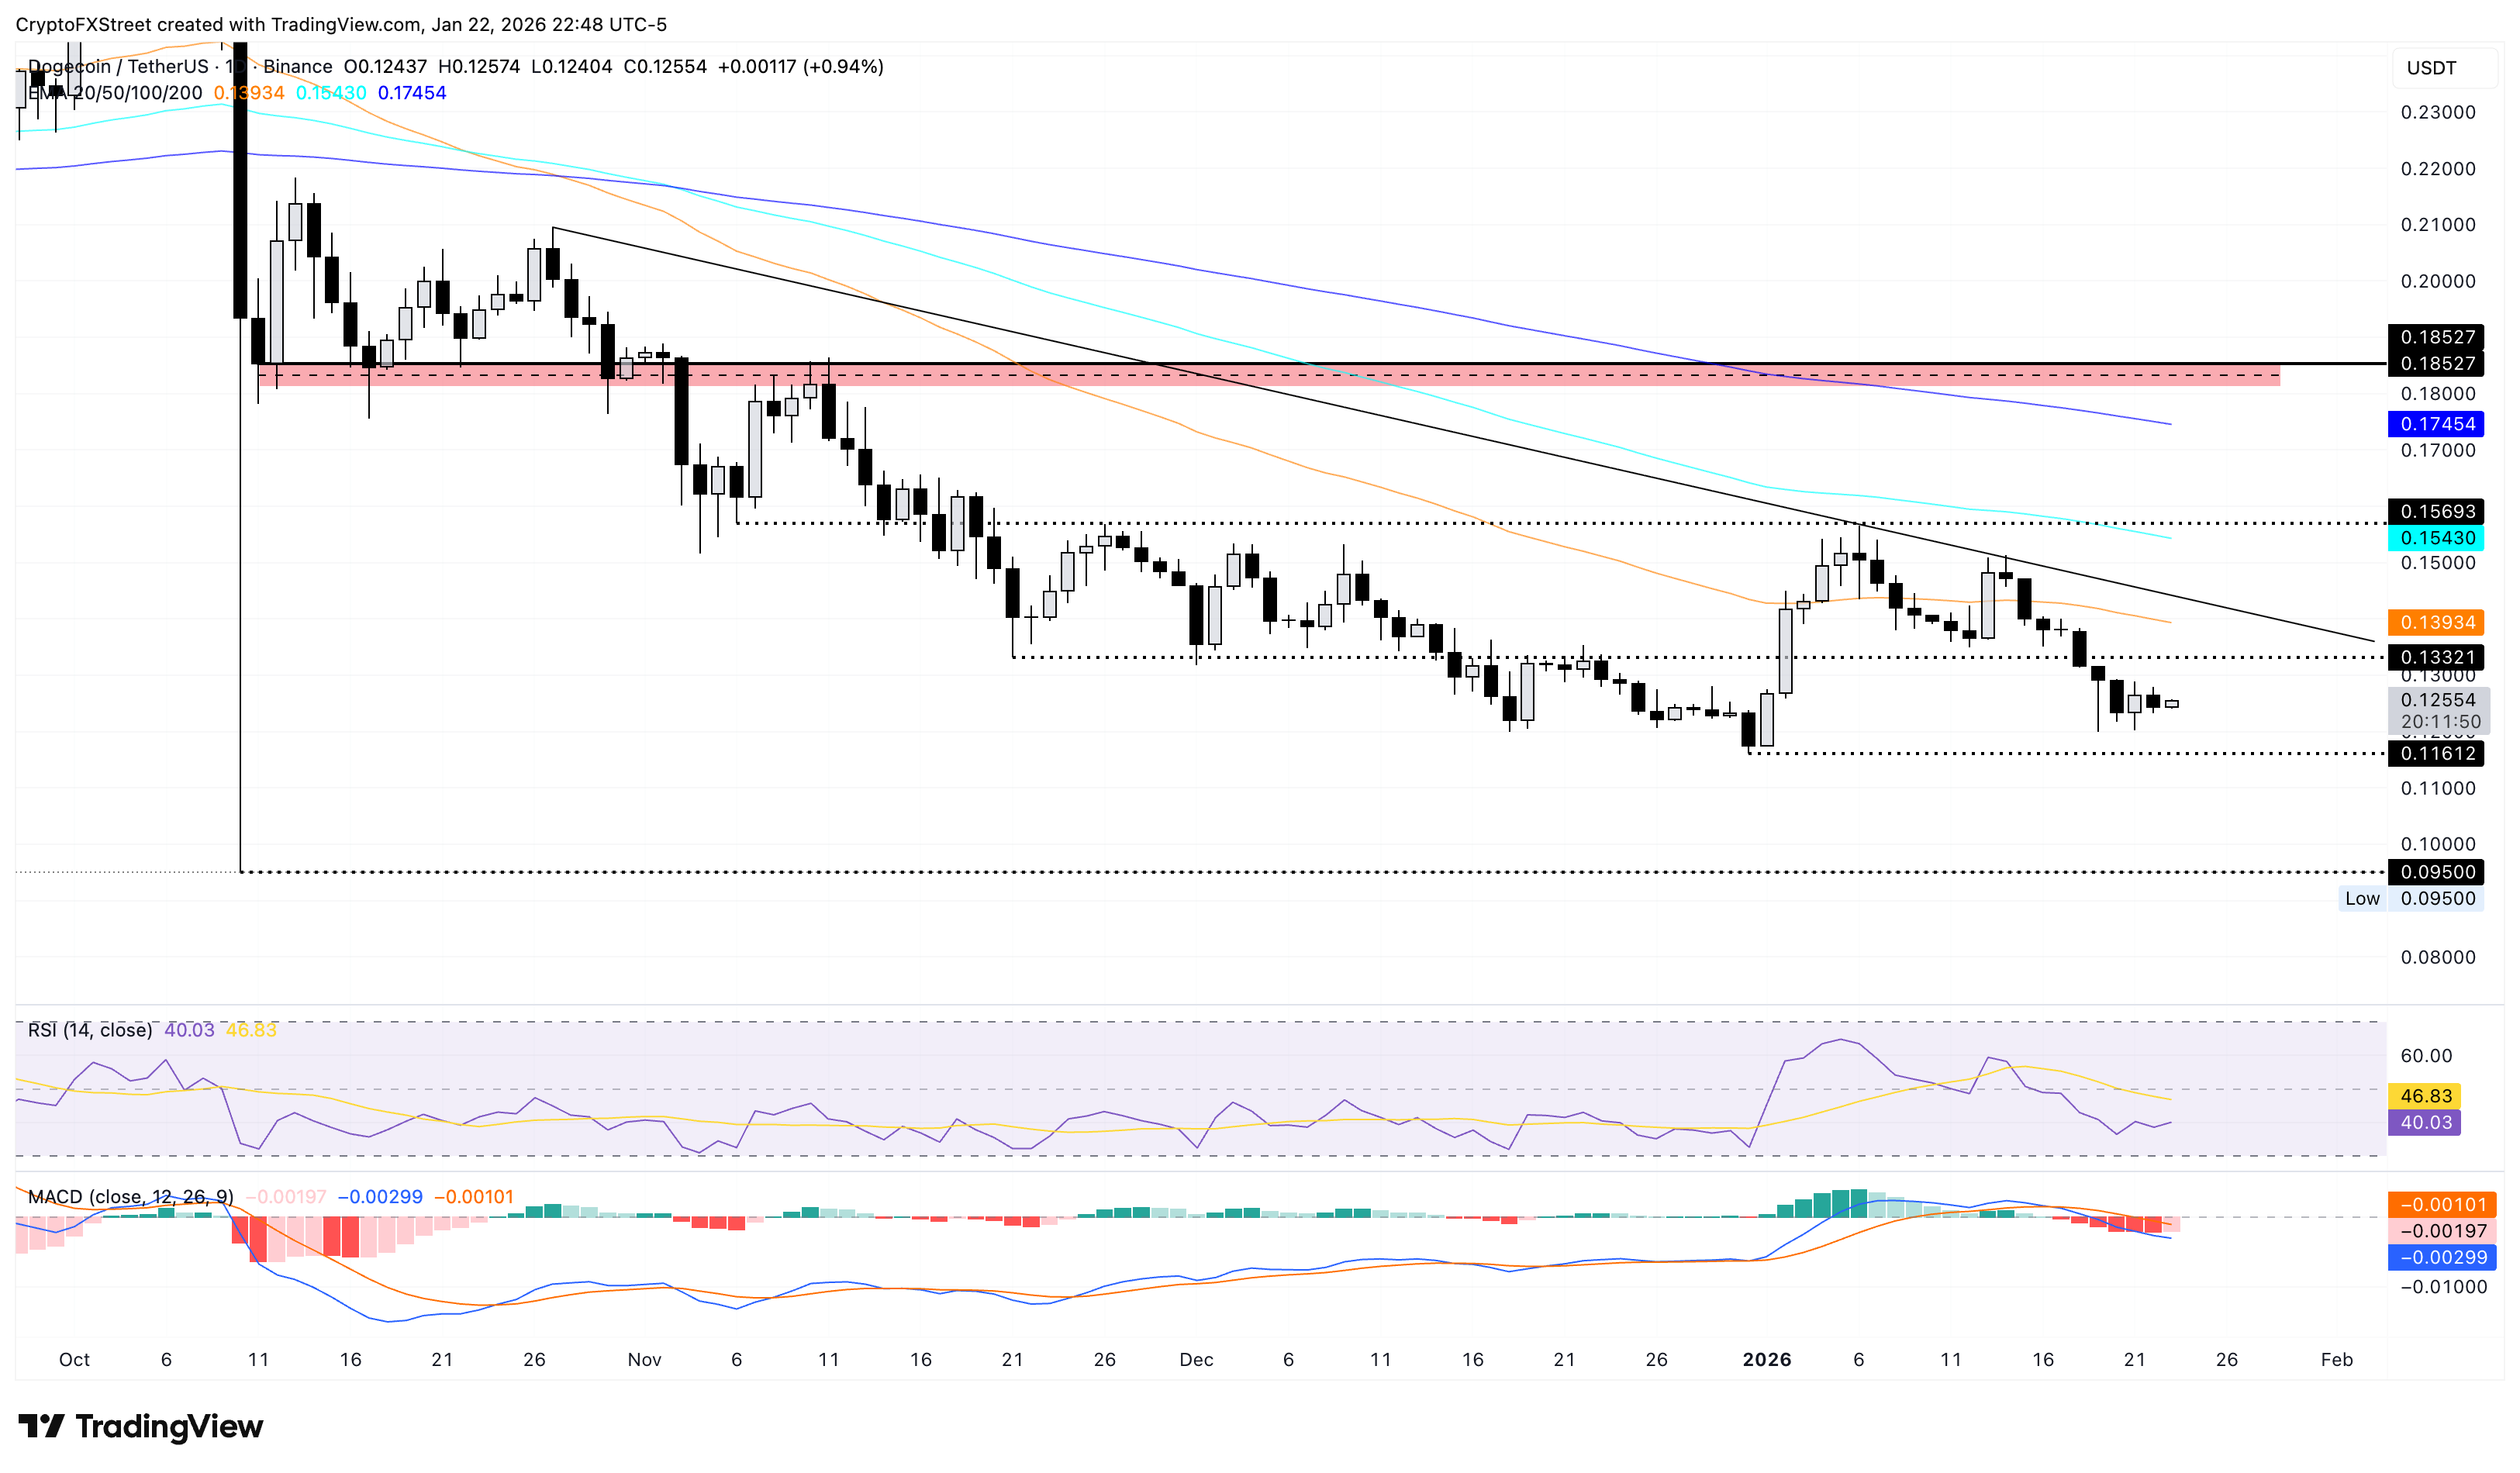
On the upside, a potential rebound could test the $0.1332 support-turned-resistance level marked by the November 21 low.
Shiba Inu’s short-term gains fuel consolidation
Shiba Inu recovers over 1% at the time of writing on Friday, consolidating below the 50-day EMA at $0.00000829. SHIB hovers above the $0.00000755 support marked by the November 21 low.
If SHIB drops below this level, it would threaten the $0.00000678 low from October 10, risking a fresh low.
The RSI is at 45 on the daily chart, below the halfway line, with further downside room, reflecting bearish potential. The MACD extends the decline below the zero line, signaling intense bearish momentum.
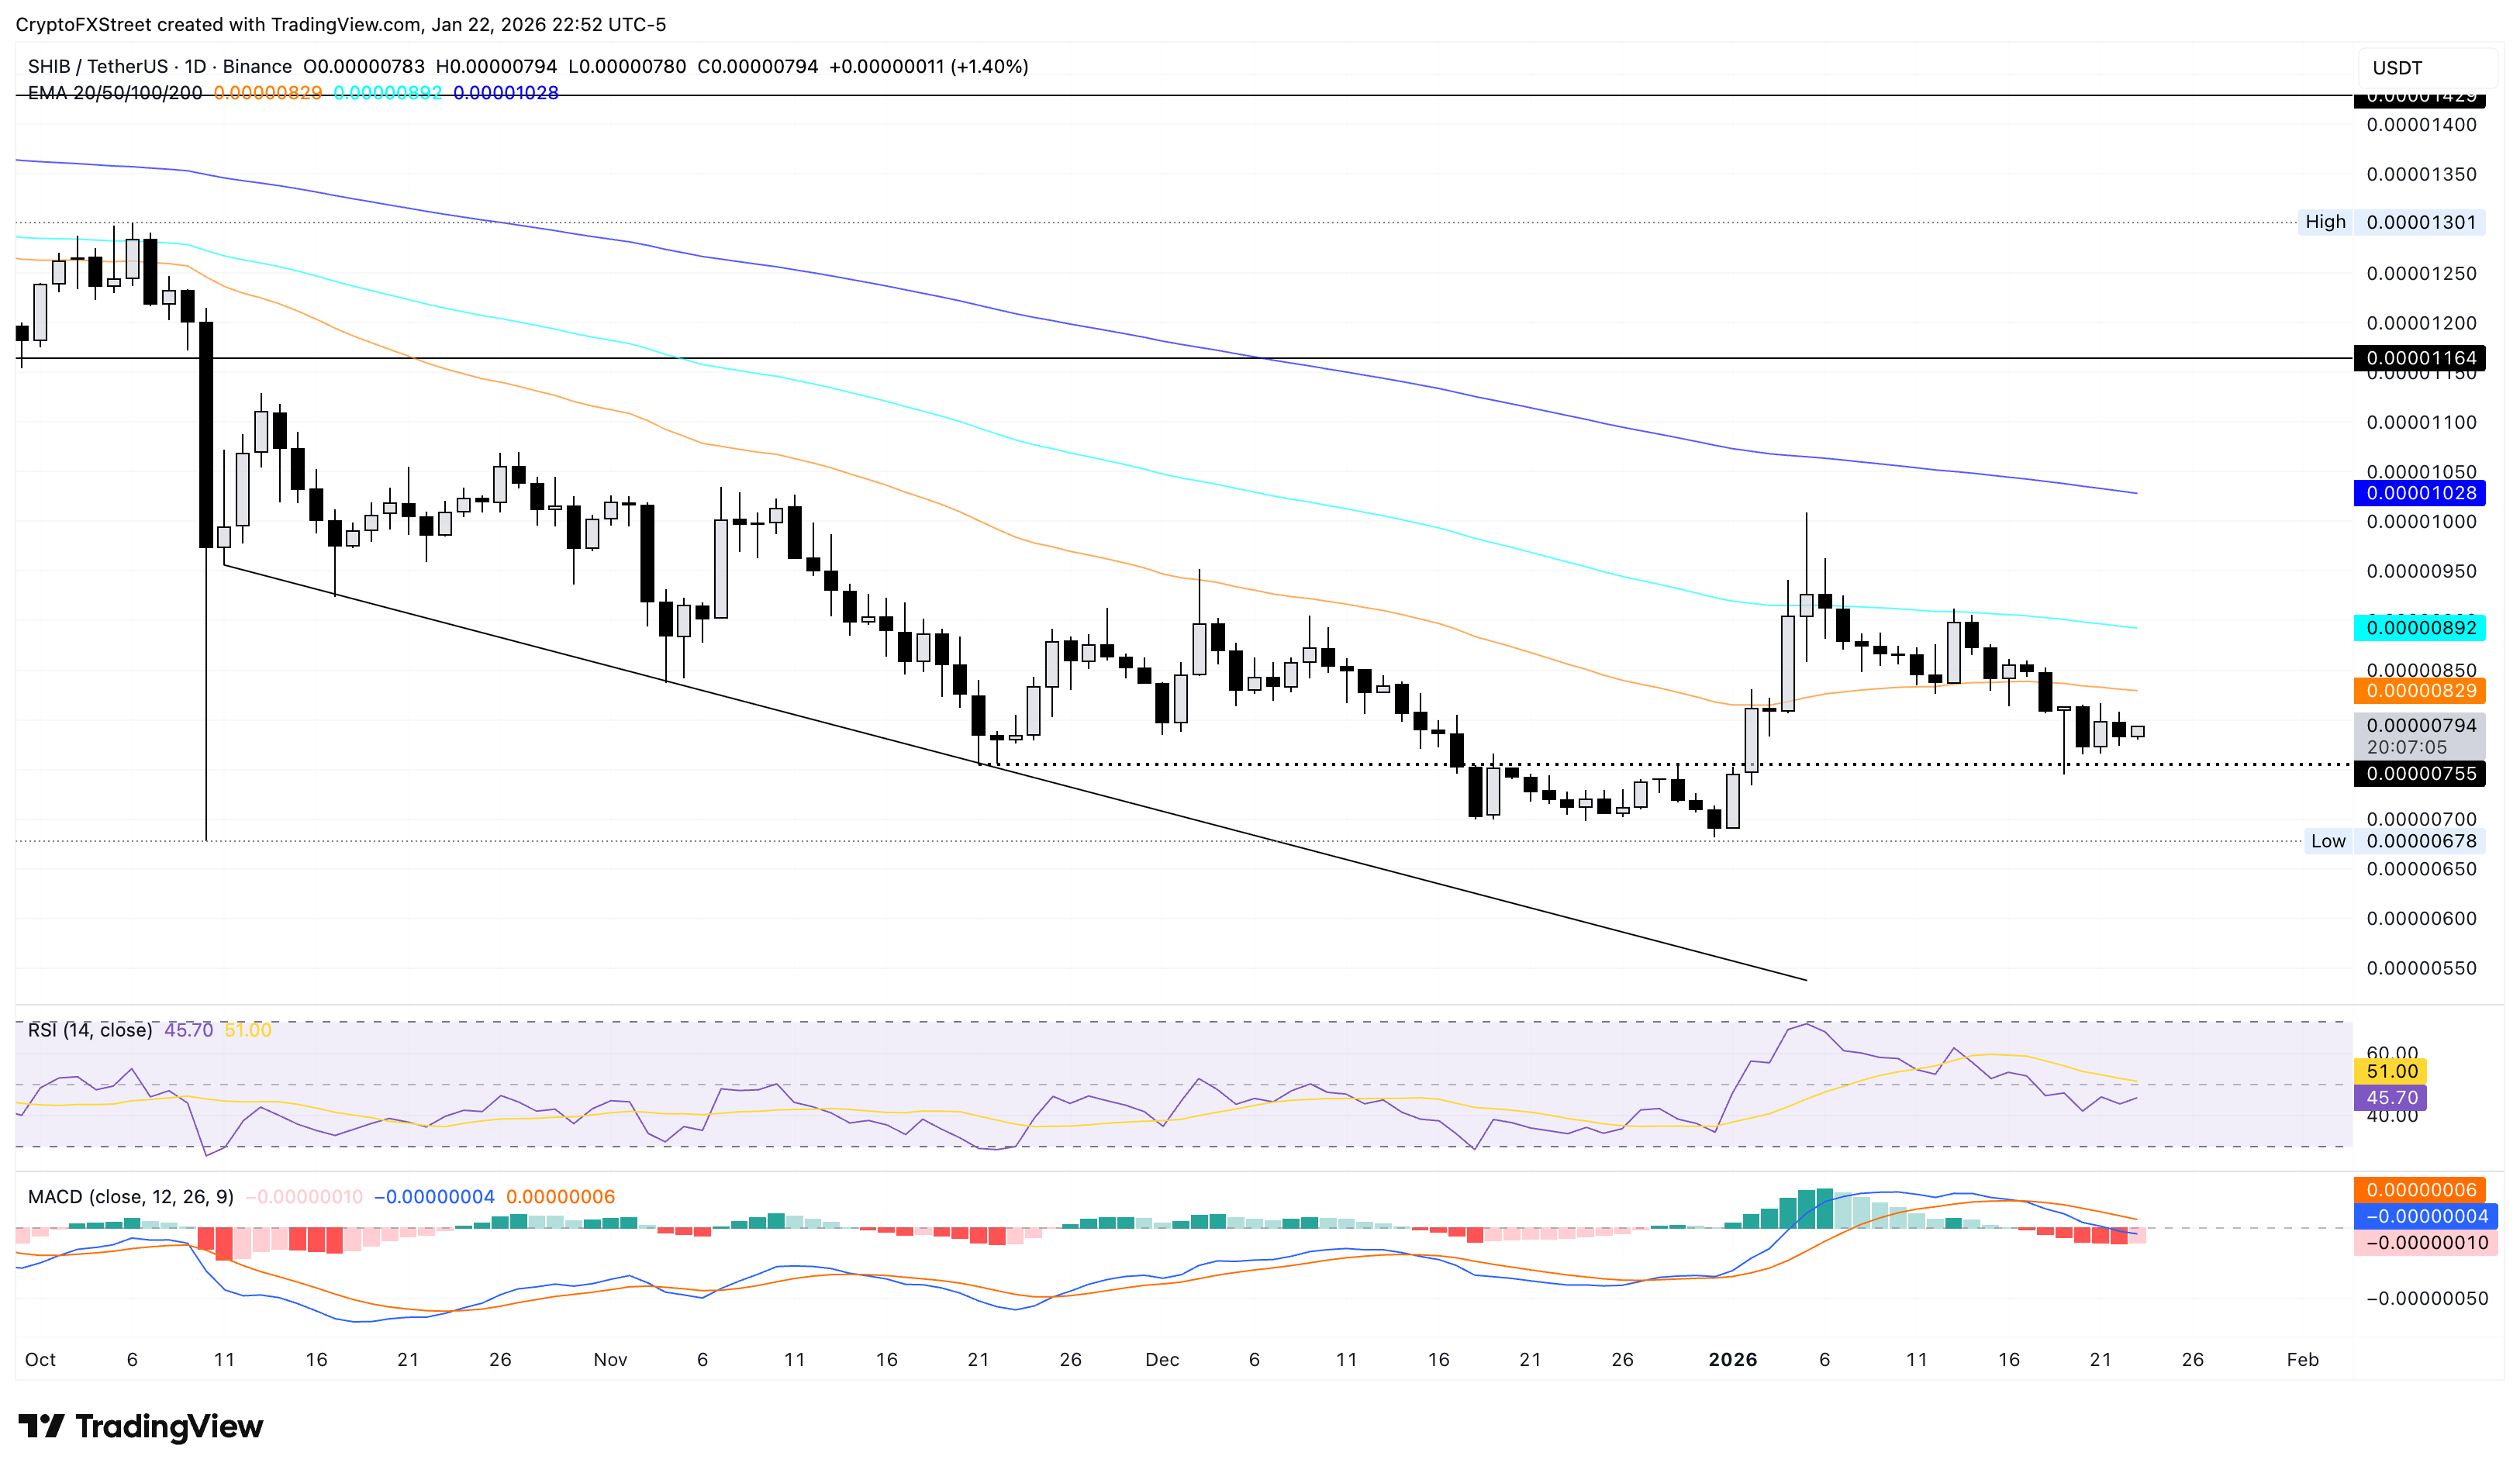
Looking up, the 50-day, 100-day, and 200-day EMAs at $0.00000829, $0.00000892, and $0.00001028, respectively, would likely cap short-term recoveries in SHIB.
Pepe is at a crucial psychological support, but risks further downside
Pepe extends its decline below the 50-day EMA at $0.00000535, with a nearly 8% loss so far this week. At the time of writing, PEPE lingers above the $0.00000500 psychological level on Friday, risking further decline after a 4% drop the previous day.
The crucial support at $0.00000363, which aligns with the December 18 low, signals a significant downside risk.
The RSI is at 41 on the daily chart and has crossed below the midline, while the MACD indicator shows a steady decline in both average lines, signaling a bearish bias in trend momentum.
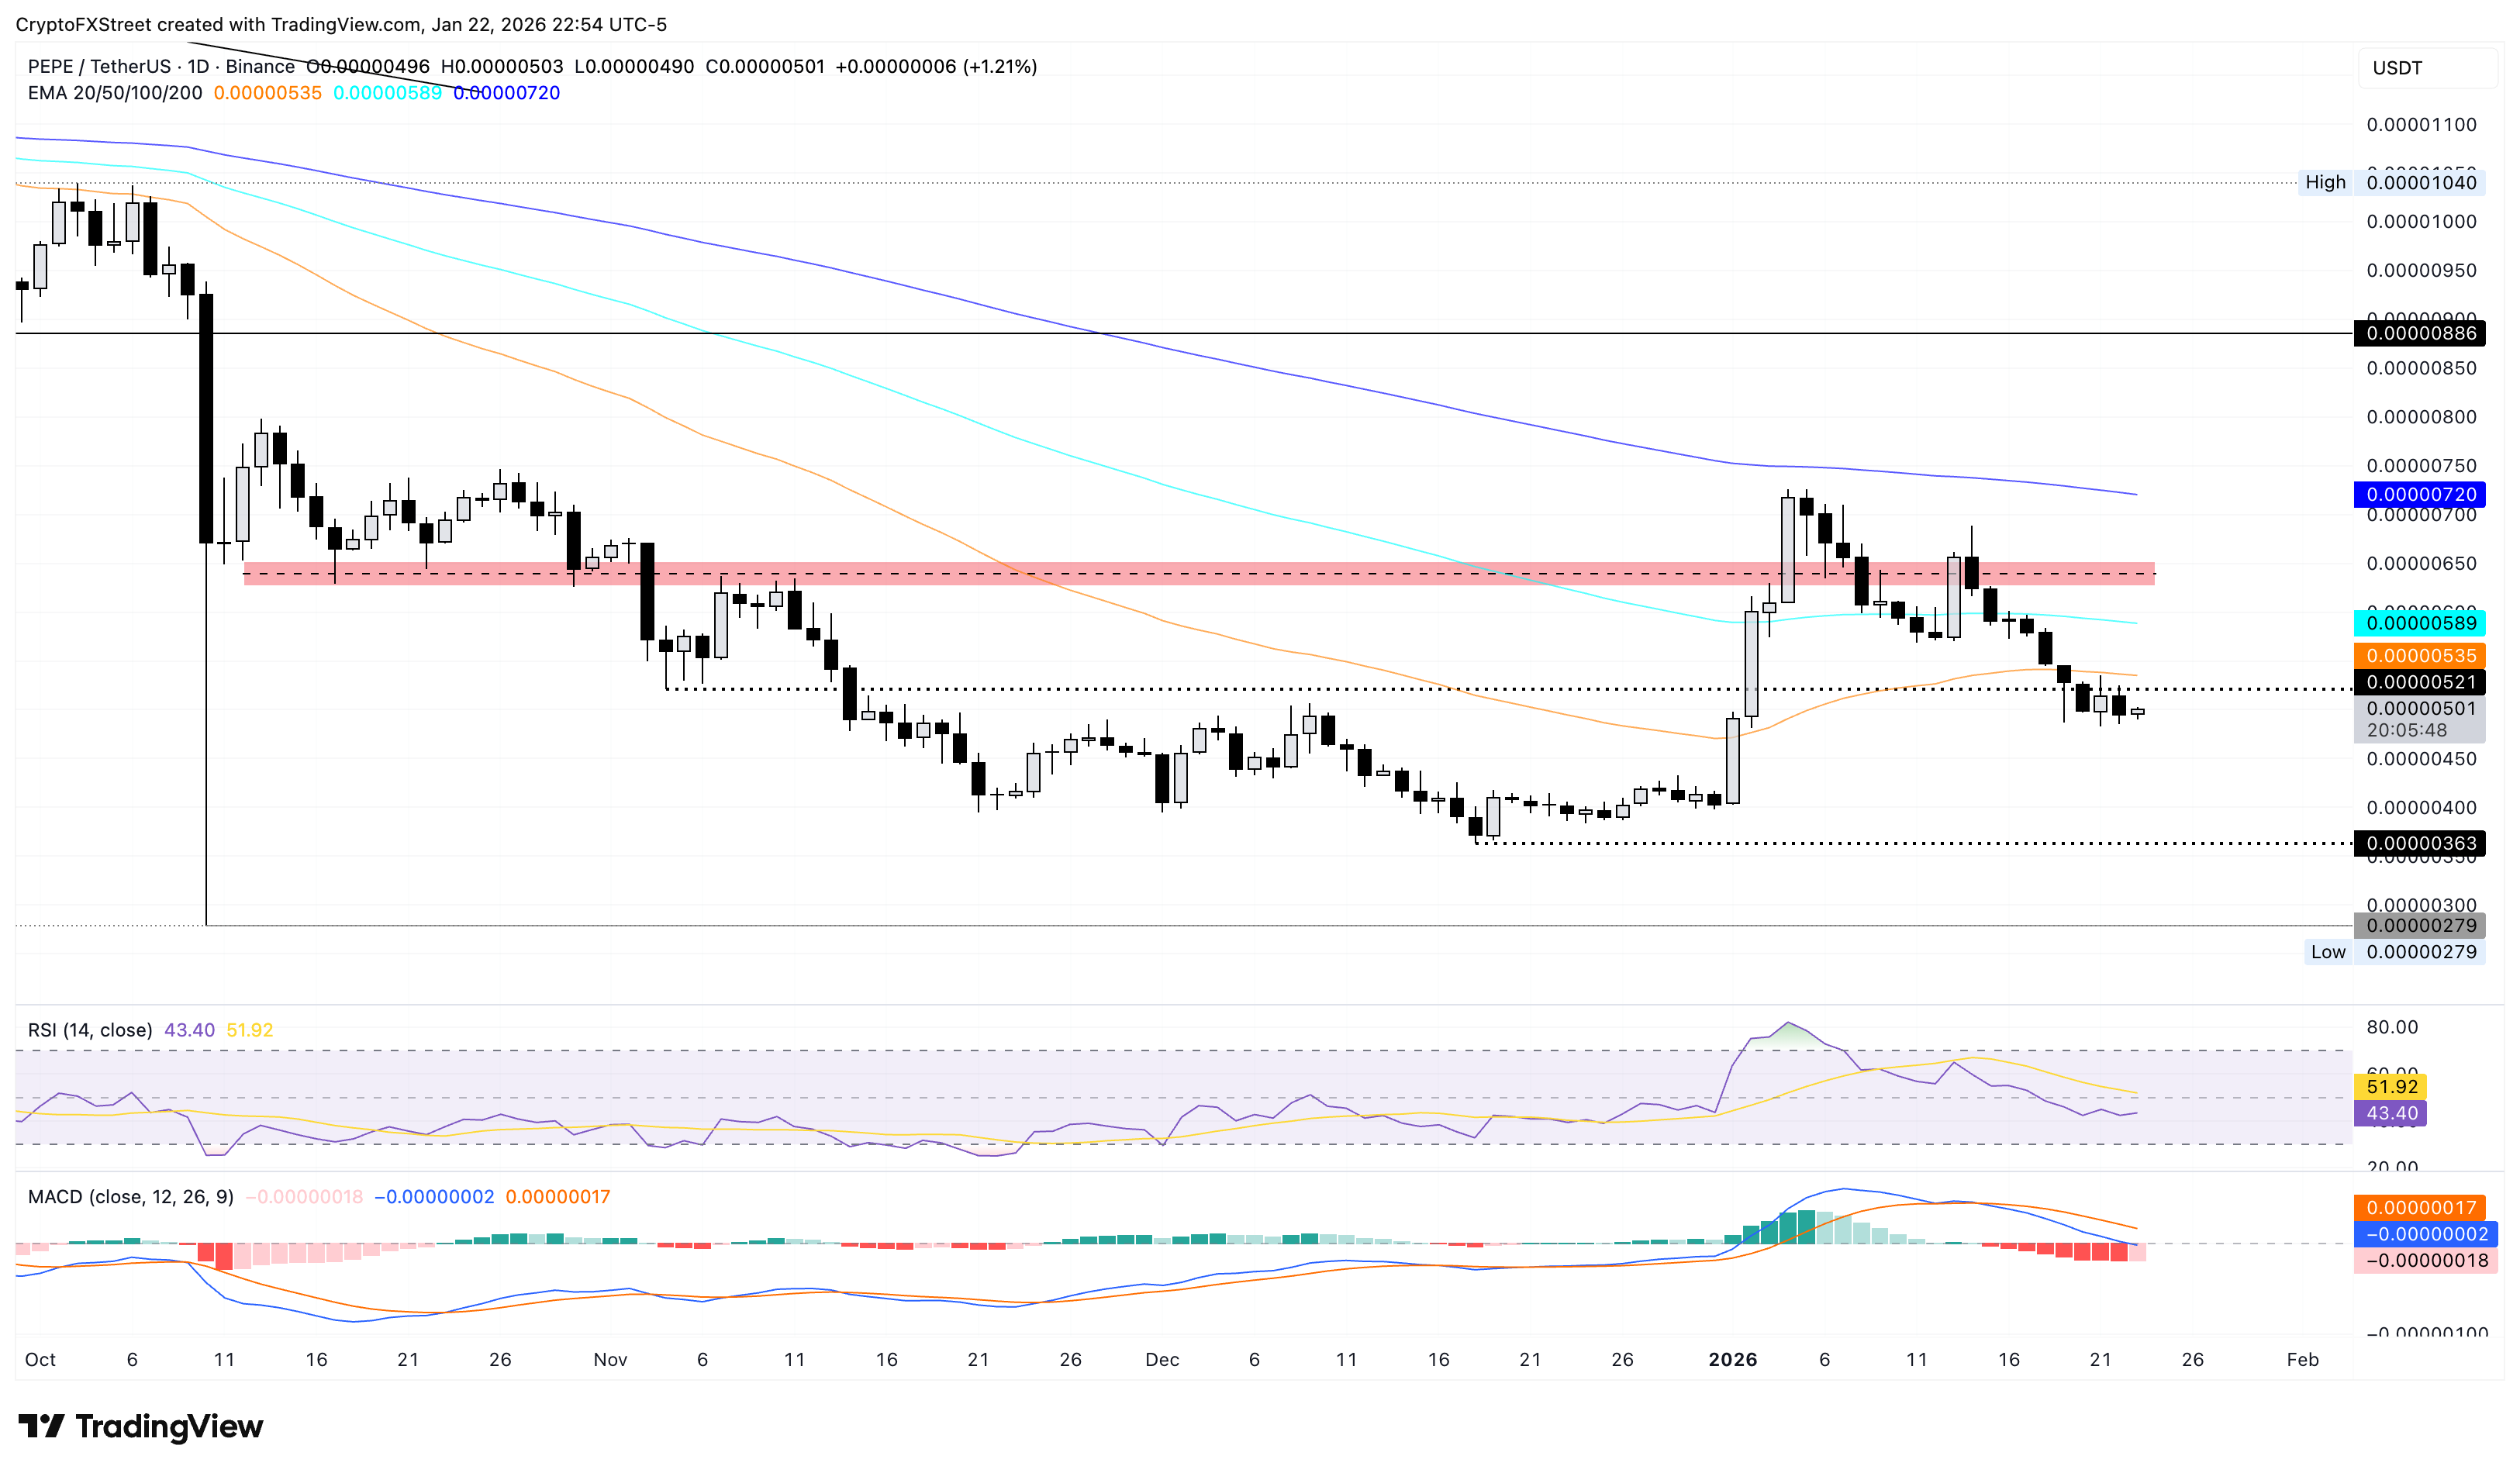
If PEPE rebounds from $0.00000500, it would face immediate resistance at the 50-day EMA at $0.00000535, followed by the 100-day EMA at $0.00000589.

100만 명이 넘는 사용자가 FXStreet를 통해 실시간 시장 데이터, 차트 도구, 전문가 인사이트, 포렉스 뉴스를 이용합니다. 포괄적인 경제 캘린더와 교육 웨비나는 트레이더가 정보를 유지하고 신중한 결정을 내리도록 돕습니다. FXStreet는 바르셀로나 본사와 전 세계 지역에 걸쳐 약 60명의 팀으로 구성되어 있습니다.
더 읽기


