
NZD/USD Price Forecast: Kiwi hits 0.5755 support as bullish momentum eases
작성자 Guillermo Alcala
게시일: 18 Dec 2025 | 수정일: 18 Dec 2025


인기 기사

The New Zealand Dollar has failed to draw any significant support from the strong New Zealand GDP figures and is losing ground against the US Dollar. The pair is hovering right above the 0.5755 support area at the time of writing, after having peaked at 0.5830 last week.
- NZD/USD drifts lower to test support at the 0.5755 area.
- The Kiwi remains on the back foot despite strong New Zealand GDP figures.
- Technical indicators suggest that the rally from late-November lows has lost momentum.
The New Zealand Dollar has failed to draw any significant support from the strong New Zealand GDP figures and is losing ground against the US Dollar. The pair is hovering right above the 0.5755 support area at the time of writing, after having peaked at 0.5830 last week.
Data released on Wednesday revealed that New Zealand’s economy bounced up to grow 1.1% in the third quarter, offsetting the 1% contraction in the first and beating expectations of a 0.9% growth. The pair, however, has remained vulnerable this week, amid a firmer US Dollar, with investors wary of selling US Dollars ahead of the release of November’s US CPI, due later on the day.
Technical Analysis: Indicators show a growing bearish momentum
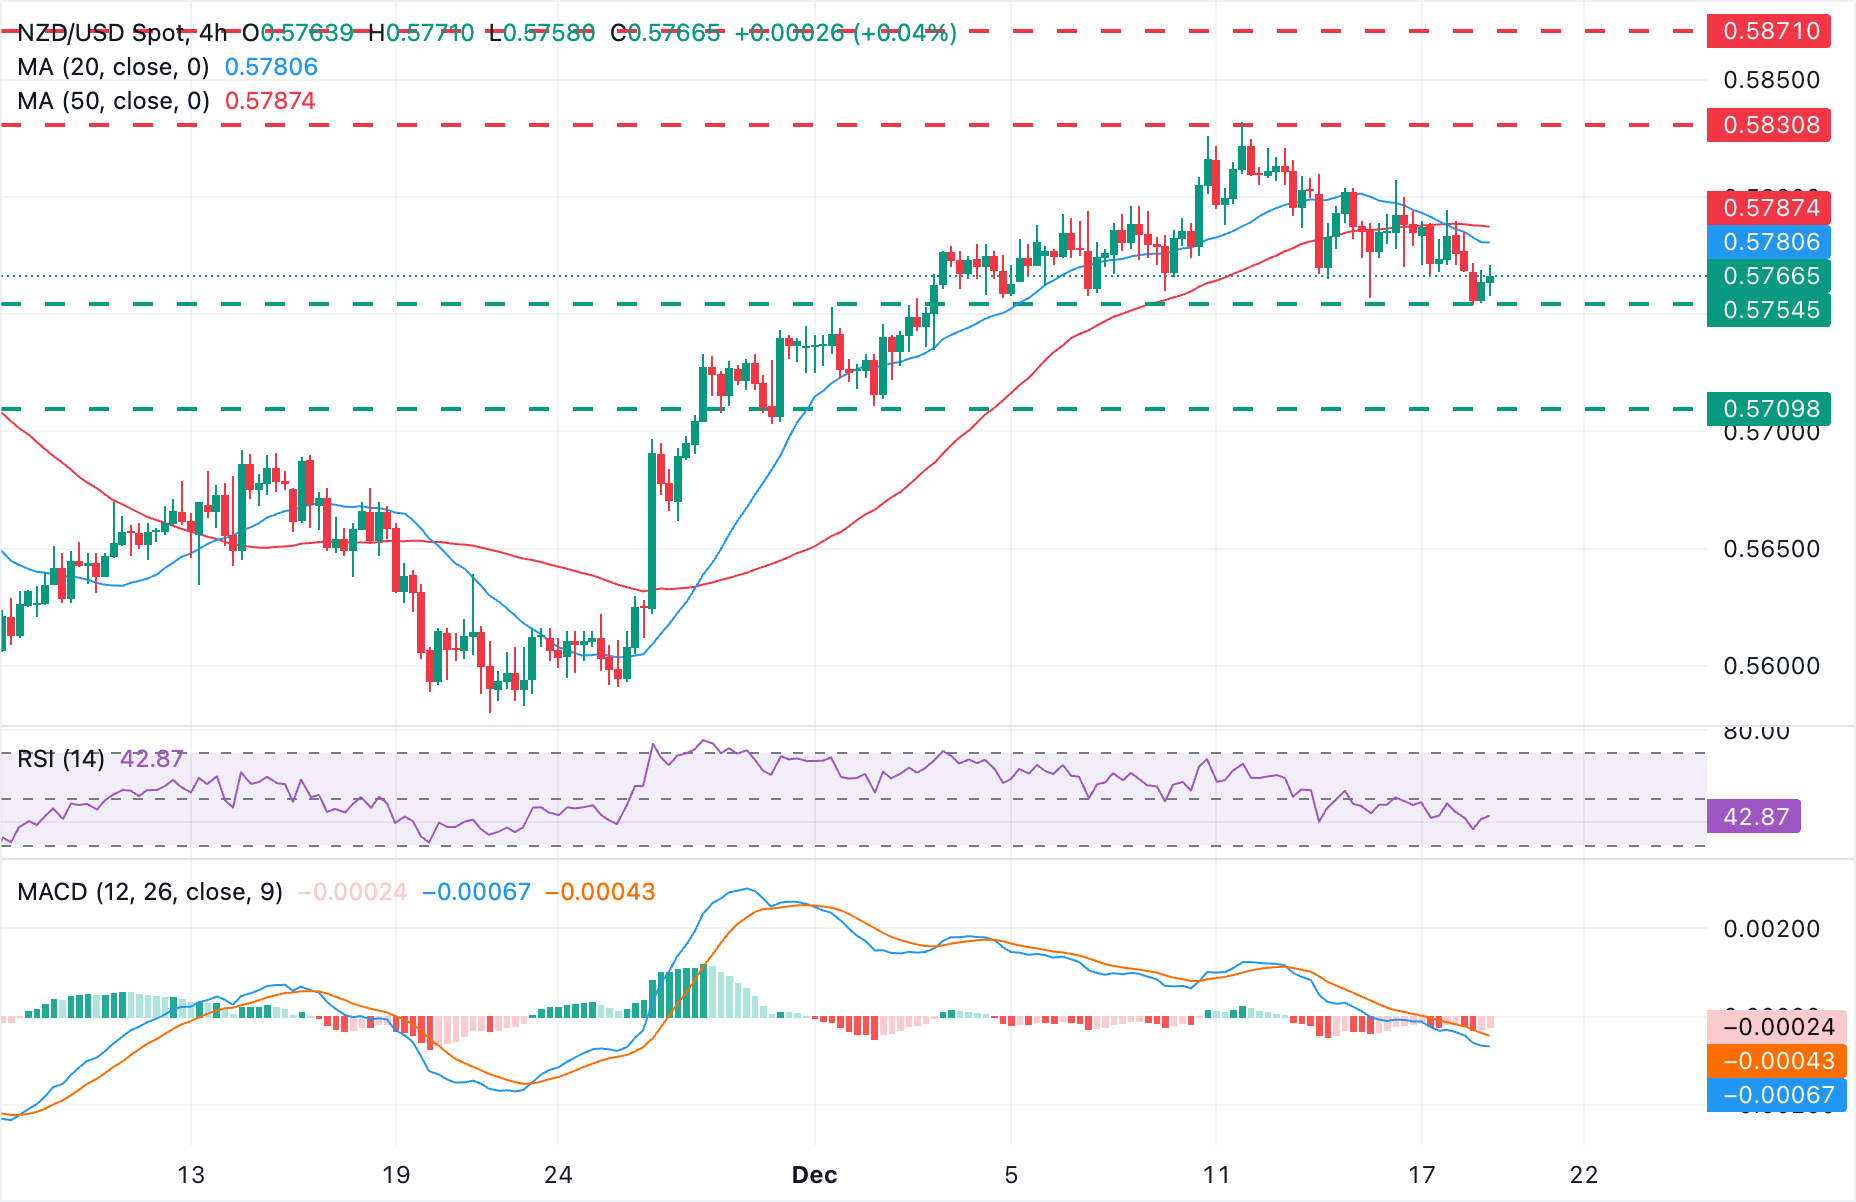
The 4-hour chart shows the NZD/USD trading at 0.5767 after falling in five out of the last six trading days. The 20-period Simple Moving Average (SMA) has slipped beneath the 50-period SMA, pointing to a soft bearish bias. The Moving Average Convergence Divergence (MACD) histogram stays marginally negative while the Relative Strength Index (RSI) consolidates below the 50 midline, suggesting that sellers have taken control.
The pair is now hovering above a key support area at 0.5755, where bears were contained on December 4, 8, 10, and 16. Further down, the next target is the 0.5700-0.5710 area (November 28, December 2 low). On the upside, immediate resistance is at the 50-period SMA, near 0.5790, ahead of the December 11 high, at 0.5830, and the September 23 high, at 0.5870.
(The technical analysis of this story was written with the help of an AI tool)
US Dollar Price Today
The table below shows the percentage change of US Dollar (USD) against listed major currencies today. US Dollar was the strongest against the Euro.
| USD | EUR | GBP | JPY | CAD | AUD | NZD | CHF | |
|---|---|---|---|---|---|---|---|---|
| USD | 0.14% | -0.07% | 0.05% | -0.01% | -0.10% | 0.11% | -0.09% | |
| EUR | -0.14% | -0.21% | -0.13% | -0.16% | -0.23% | -0.02% | -0.24% | |
| GBP | 0.07% | 0.21% | 0.10% | 0.05% | -0.03% | 0.18% | -0.03% | |
| JPY | -0.05% | 0.13% | -0.10% | -0.06% | -0.13% | 0.06% | -0.13% | |
| CAD | 0.01% | 0.16% | -0.05% | 0.06% | -0.08% | 0.11% | -0.08% | |
| AUD | 0.10% | 0.23% | 0.03% | 0.13% | 0.08% | 0.21% | -0.00% | |
| NZD | -0.11% | 0.02% | -0.18% | -0.06% | -0.11% | -0.21% | -0.22% | |
| CHF | 0.09% | 0.24% | 0.03% | 0.13% | 0.08% | 0.00% | 0.22% |
The heat map shows percentage changes of major currencies against each other. The base currency is picked from the left column, while the quote currency is picked from the top row. For example, if you pick the US Dollar from the left column and move along the horizontal line to the Japanese Yen, the percentage change displayed in the box will represent USD (base)/JPY (quote).

100만 명이 넘는 사용자가 FXStreet를 통해 실시간 시장 데이터, 차트 도구, 전문가 인사이트, 포렉스 뉴스를 이용합니다. 포괄적인 경제 캘린더와 교육 웨비나는 트레이더가 정보를 유지하고 신중한 결정을 내리도록 돕습니다. FXStreet는 바르셀로나 본사와 전 세계 지역에 걸쳐 약 60명의 팀으로 구성되어 있습니다.
더 읽기


