
NZD/USD Price Forecast: Rangebound trading between 0.5870 and 0.5930
작성자 Guillermo Alcala
수정됨: 23 Apr 2026


인기 기사

The New Zealand Dollar (NZD) posts moderate losses against a stronger US Dollar (USD) on Thursday as the escalating tensions between the US and Iran curb risk appetite.
- NZD/USD edges down on Thursday but remains trapped between 0.5870 and 0.5930.
- Investors are wary of placing large directional bets amid the stalemate in the Middle East conflict.
- Technical indicators show a moderately bearish tone on the 4-hour chart.
The New Zealand Dollar (NZD) posts moderate losses against a stronger US Dollar (USD) on Thursday as the escalating tensions between the US and Iran curb risk appetite. The pair, however, remains trapped within the last few days’ trading range, with upside attempts capped below 0.5930, and bears contained above previous highs, in the 0.5870 area.
New Zealand’s consumer inflation data, released earlier this week, confirmed that price pressures remain above the Reserve Bank of New Zealand’s target rate and provided some support to the Kiwi. Nevertheless, traders are reluctant to take large directional positions amid a tense stalemate in the Middle East, which leaves the NZD/USD hovering in no-man’s-land.
Technical indicators show moderate bearish pressure
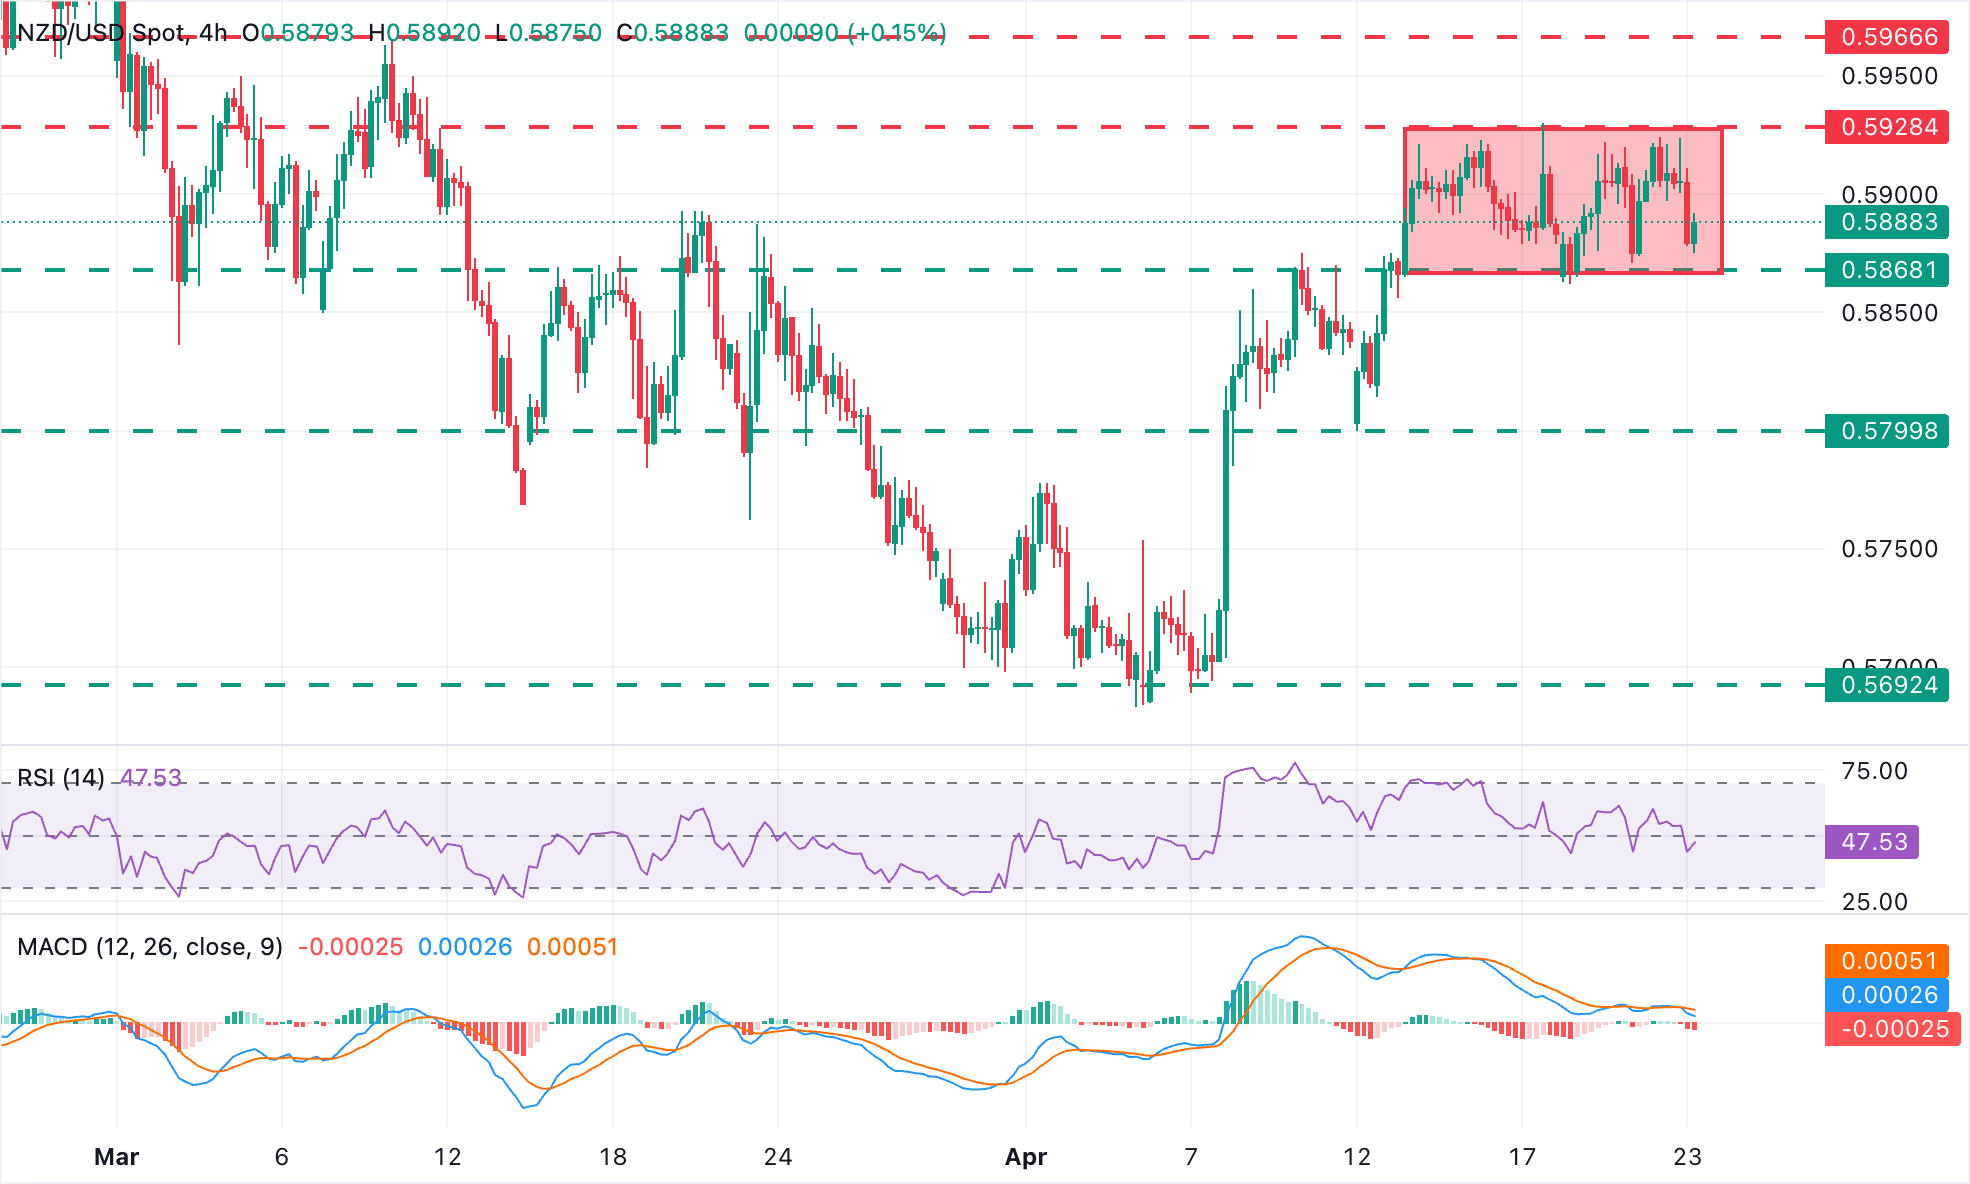
NZD/USD maintains the constructive structure from early April lows in place, but price action has stalled, and technical indicators on the 4-hour chart are turning negative on Thursday, which shifts the focus to the 0.5870 support area.
The Relative Strength Index (RSI) has pulled back to levels immediately below the 50 midline, hinting that upside momentum is fading, while the Moving Average Convergence Divergence (MACD) histogram has turned slightly negative, reinforcing the idea of waning bullish pressure.
The pair, however, seems to need an additional impulse to break down the 0.5860-05870 area, which held bulls on Monday and Tuesday. This would open the door for a bearish reversal towards the April 13 lows at the 0.5800 area. Further down, the mentioned early April lows, right below 0.5700, would come into focus.
Bulls, on the contrary, would have to breach resistance at the 0.5930 area (April 17, 22 highs) to extend the near-term upside trend towards the March 10 high, around 0.5965, and the late-February highs around the 0.6000 psychological level.
(The technical analysis of this story was written with the help of an AI tool.)
US Dollar Price Today
The table below shows the percentage change of US Dollar (USD) against listed major currencies today. US Dollar was the strongest against the New Zealand Dollar.
| USD | EUR | GBP | JPY | CAD | AUD | NZD | CHF | |
|---|---|---|---|---|---|---|---|---|
| USD | 0.00% | 0.09% | 0.06% | -0.00% | 0.11% | 0.29% | 0.03% | |
| EUR | -0.00% | 0.11% | 0.07% | -0.00% | 0.09% | 0.28% | 0.02% | |
| GBP | -0.09% | -0.11% | -0.02% | -0.11% | 0.00% | 0.19% | -0.09% | |
| JPY | -0.06% | -0.07% | 0.02% | -0.08% | 0.05% | 0.19% | -0.04% | |
| CAD | 0.00% | 0.00% | 0.11% | 0.08% | 0.13% | 0.29% | 0.02% | |
| AUD | -0.11% | -0.09% | 0.00% | -0.05% | -0.13% | 0.19% | -0.11% | |
| NZD | -0.29% | -0.28% | -0.19% | -0.19% | -0.29% | -0.19% | -0.28% | |
| CHF | -0.03% | -0.02% | 0.09% | 0.04% | -0.02% | 0.11% | 0.28% |
The heat map shows percentage changes of major currencies against each other. The base currency is picked from the left column, while the quote currency is picked from the top row. For example, if you pick the US Dollar from the left column and move along the horizontal line to the Japanese Yen, the percentage change displayed in the box will represent USD (base)/JPY (quote).

100만 명이 넘는 사용자가 FXStreet를 통해 실시간 시장 데이터, 차트 도구, 전문가 인사이트, 포렉스 뉴스를 이용합니다. 포괄적인 경제 캘린더와 교육 웨비나는 트레이더가 정보를 유지하고 신중한 결정을 내리도록 돕습니다. FXStreet는 바르셀로나 본사와 전 세계 지역에 걸쳐 약 60명의 팀으로 구성되어 있습니다.
더 읽기


