
NZD/USD Price Forecast: Stays near 0.5850 after rebounding from levels near nine-day EMA
작성자 Akhtar Faruqui
수정됨: 13 Apr 2026


인기 기사

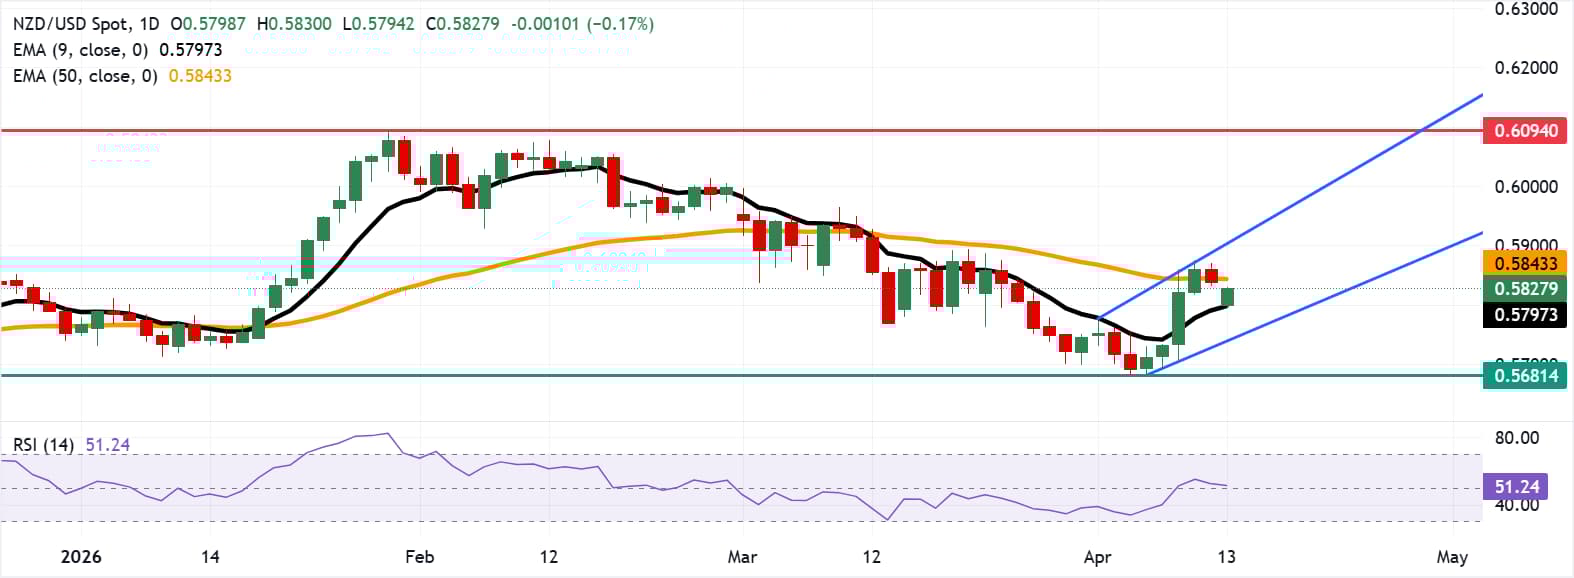
NZD/USD rises after opening at a gap down, trading around 0.5830 during the Asian hours on Monday. The technical analysis of the daily chart signals a potential for a bullish bias as the pair remains within the emerging ascending channel pattern.
- NZD/USD may find the initial resistance at the 50-day EMA of 0.5843.
- The 14-day Relative Strength Index is just above 51, suggesting mildly positive momentum.
- The nine-day EMA at 0.5797 provides immediate support.
NZD/USD rises after opening at a gap down, trading around 0.5830 during the Asian hours on Monday. The technical analysis of the daily chart signals a potential for a bullish bias as the pair remains within the emerging ascending channel pattern.
The 14-day Relative Strength Index (RSI) hovers just above 51, hinting at mildly constructive momentum but not yet signaling a decisive directional break while price remains capped beneath the longer EMA.
However, the NZD/USD pair is caught between a supportive nine-day Exponential Moving Average (EMA) and overhead pressure from the 50-day EMA, leaving the near-term tone broadly range-bound.
The primary resistance lies at the medium-term average at 0.5843, followed by the upper boundary of the ascending channel around 0.5900. A break above the channel would support the NZD/USD pair to explore the region around 0.6094, the highest since July 2025, which was reached on January 29.
The nine-day EMA at 0.5797 acts as an immediate support, followed by the lower ascending channel boundary around 0.5740. Further decline below the channel would expose 0.5681, the weakest level in nearly five months, recorded on April 6.
(The technical analysis of this story was written with the help of an AI tool.)
New Zealand Dollar Price Today
The table below shows the percentage change of New Zealand Dollar (NZD) against listed major currencies today. New Zealand Dollar was the weakest against the US Dollar.
| USD | EUR | GBP | JPY | CAD | AUD | NZD | CHF | |
|---|---|---|---|---|---|---|---|---|
| USD | 0.31% | 0.39% | 0.22% | 0.10% | 0.33% | 0.17% | 0.30% | |
| EUR | -0.31% | 0.06% | -0.07% | -0.20% | -0.00% | -0.14% | 0.03% | |
| GBP | -0.39% | -0.06% | -0.17% | -0.29% | -0.07% | -0.22% | -0.08% | |
| JPY | -0.22% | 0.07% | 0.17% | -0.18% | 0.06% | -0.10% | 0.10% | |
| CAD | -0.10% | 0.20% | 0.29% | 0.18% | 0.26% | 0.08% | 0.21% | |
| AUD | -0.33% | 0.00% | 0.07% | -0.06% | -0.26% | -0.14% | 0.06% | |
| NZD | -0.17% | 0.14% | 0.22% | 0.10% | -0.08% | 0.14% | 0.17% | |
| CHF | -0.30% | -0.03% | 0.08% | -0.10% | -0.21% | -0.06% | -0.17% |
The heat map shows percentage changes of major currencies against each other. The base currency is picked from the left column, while the quote currency is picked from the top row. For example, if you pick the New Zealand Dollar from the left column and move along the horizontal line to the US Dollar, the percentage change displayed in the box will represent NZD (base)/USD (quote).

100만 명이 넘는 사용자가 FXStreet를 통해 실시간 시장 데이터, 차트 도구, 전문가 인사이트, 포렉스 뉴스를 이용합니다. 포괄적인 경제 캘린더와 교육 웨비나는 트레이더가 정보를 유지하고 신중한 결정을 내리도록 돕습니다. FXStreet는 바르셀로나 본사와 전 세계 지역에 걸쳐 약 60명의 팀으로 구성되어 있습니다.
더 읽기


