
Pepe Price Forecast: PEPE stalls as on-chain, derivatives data flash bullish signals
작성자 Vishal Dixit
게시일: 9 Dec 2025 | 수정일: 9 Dec 2025


인기 기사

Pepe (PEPE) trades in the red on Tuesday after failing to secure a daily close above the $0.00000500 psychological level on Monday. The technical outlook remains mixed as the meme coin consolidates.
- Pepe is down 3% on Tuesday, following Monday's 7% rise, and is extending its consolidation below $0.00000500.
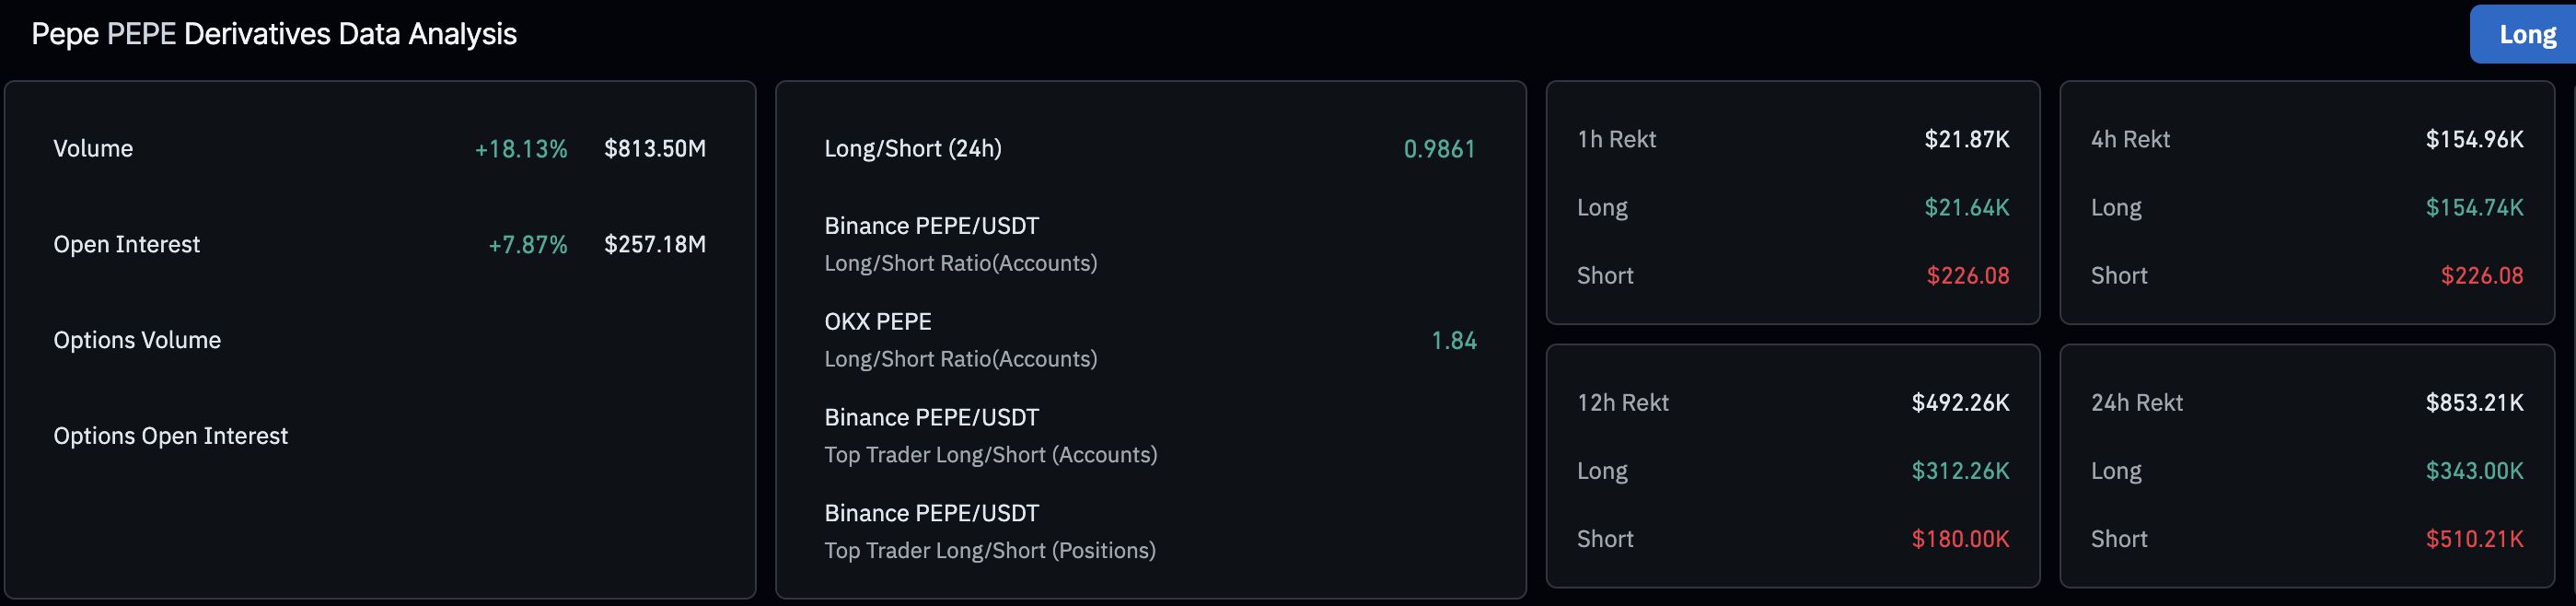
- A sudden surge in Pepe futures Open Interest points to increased investors’ confidence.
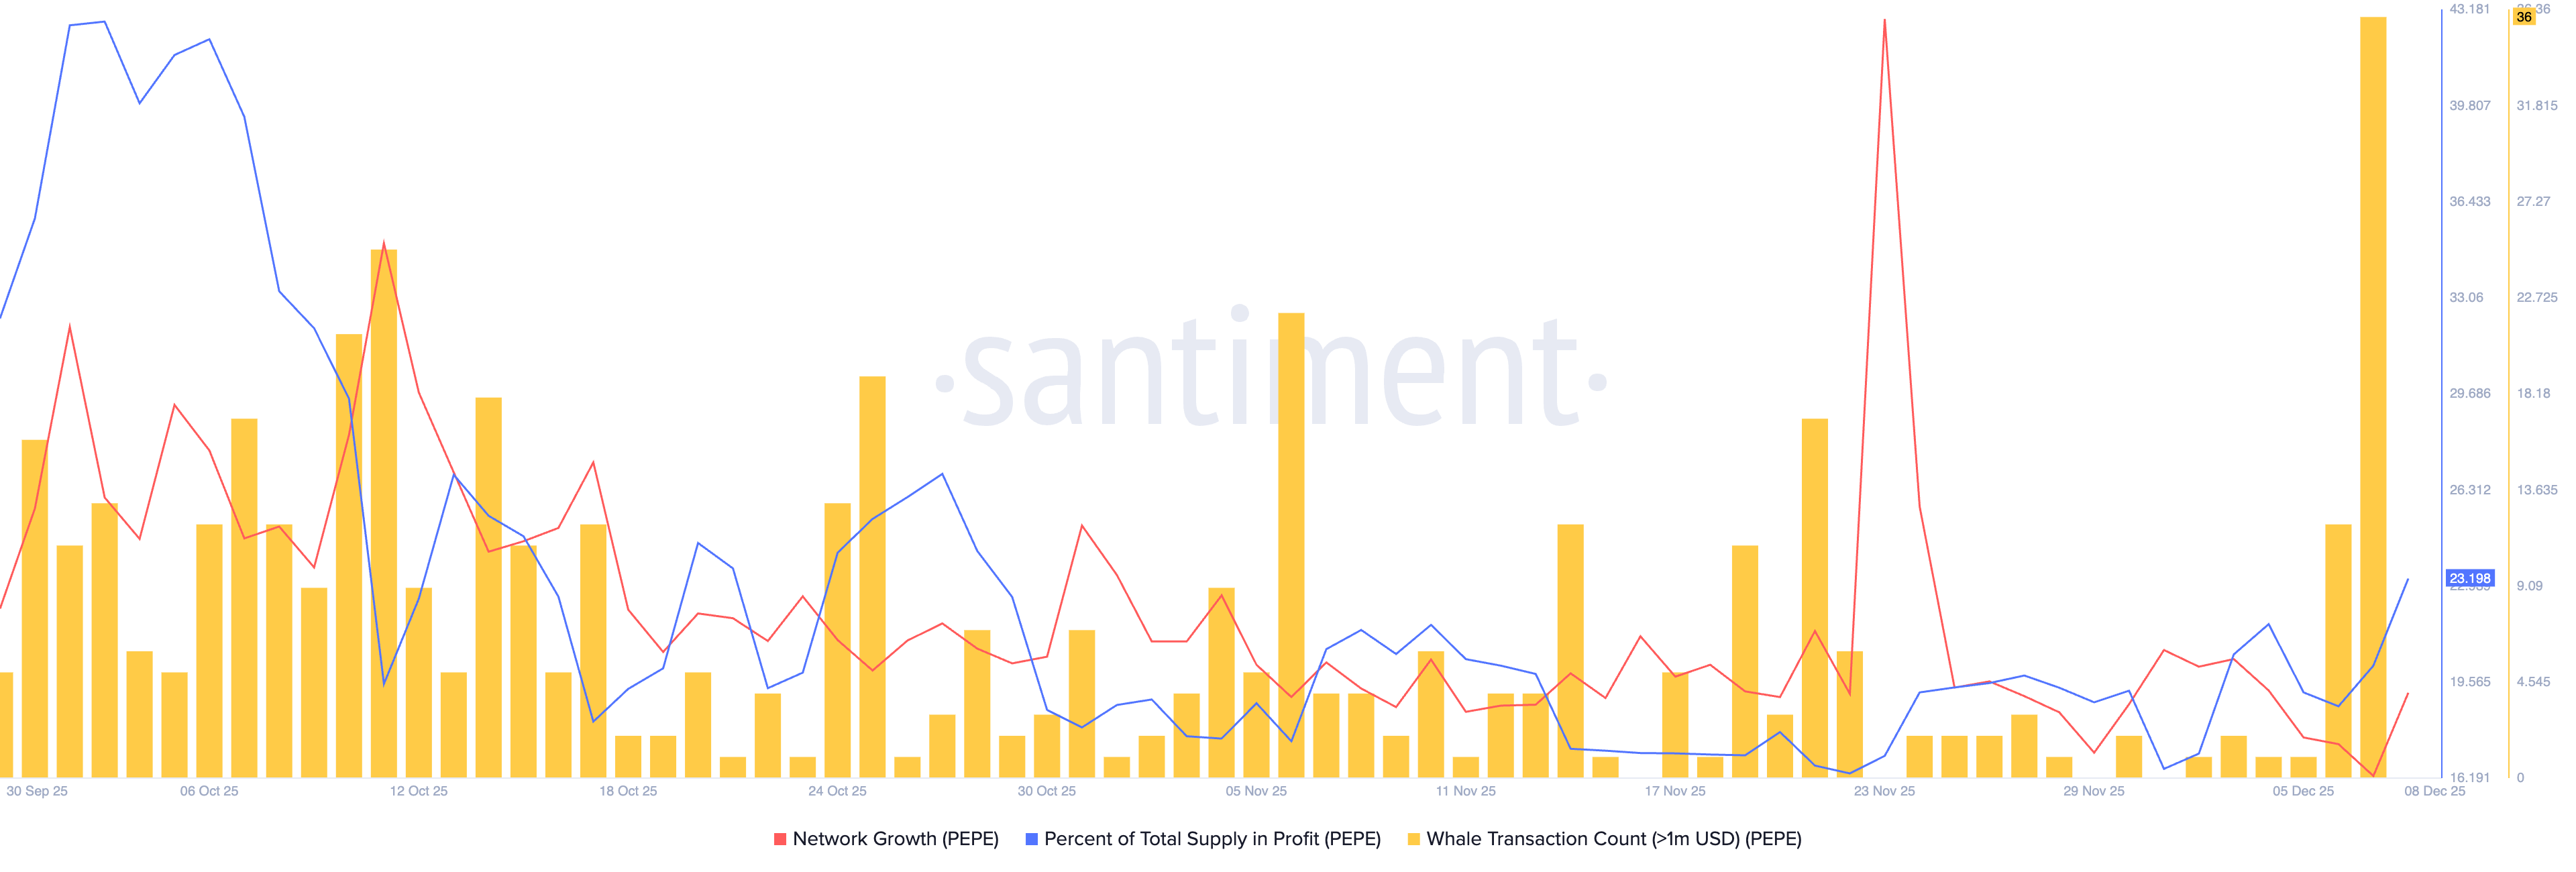
- On-chain data flashes bullish potential on rising network growth, supply in profit, and whale transactions.
Pepe (PEPE) trades in the red on Tuesday after failing to secure a daily close above the $0.00000500 psychological level on Monday. The technical outlook remains mixed as the meme coin consolidates. Still, the derivatives and on-chain data indicate a resurgence in retail interest that could boost the next rally in this frog-themed meme coin.
Derivatives and on-chain data flash bullish signals for PEPE
Pepe is regaining retail demand as derivatives traders are increasing risk exposure overnight. CoinGlass data shows a 7.87% surge in PEPE futures Open Interest (OI) in the last 24 hours, rising to $257.18 million. Generally, recovery runs in Pepe, and other meme coins are mainly driven by retail demand and speculation.
On the on-chain side, Santiment data shows a spike in network growth to 623 on Monday, up from 448 on Sunday, indicating a rise in the number of new addresses transferring PEPE for the first time. Meanwhile, the percentage of PEPE supply in profit stood at 23.20% on Monday, up from 20.14% on the previous day.
Large wallet investors, commonly referred to as whales, executed 36 transactions worth over $1 million on Sunday, signaling increased interest that fueled Monday’s 7% gains. As whales rekindle their interest in PEPE, the meme coin could regain lost levels.
Technical outlook: Could PEPE rally toward the 200-day EMA?
Pepe is trading below $0.000005000, down 3% by press time on Tuesday, potentially aiming for the $0.00000395 support level, which aligns with the November 21 low.
Still, the momentum indicators on the daily chart maintain a broadly neutral-to-bullish stance. The Relative Strength Index (RSI) at 45 is rising toward the midpoint from oversold territory, suggesting a decline in selling pressure.
Additionally, the Moving Average Convergence Divergence (MACD) remains steady near the zero line, with mainly green histogram bars, indicating bullish momentum.
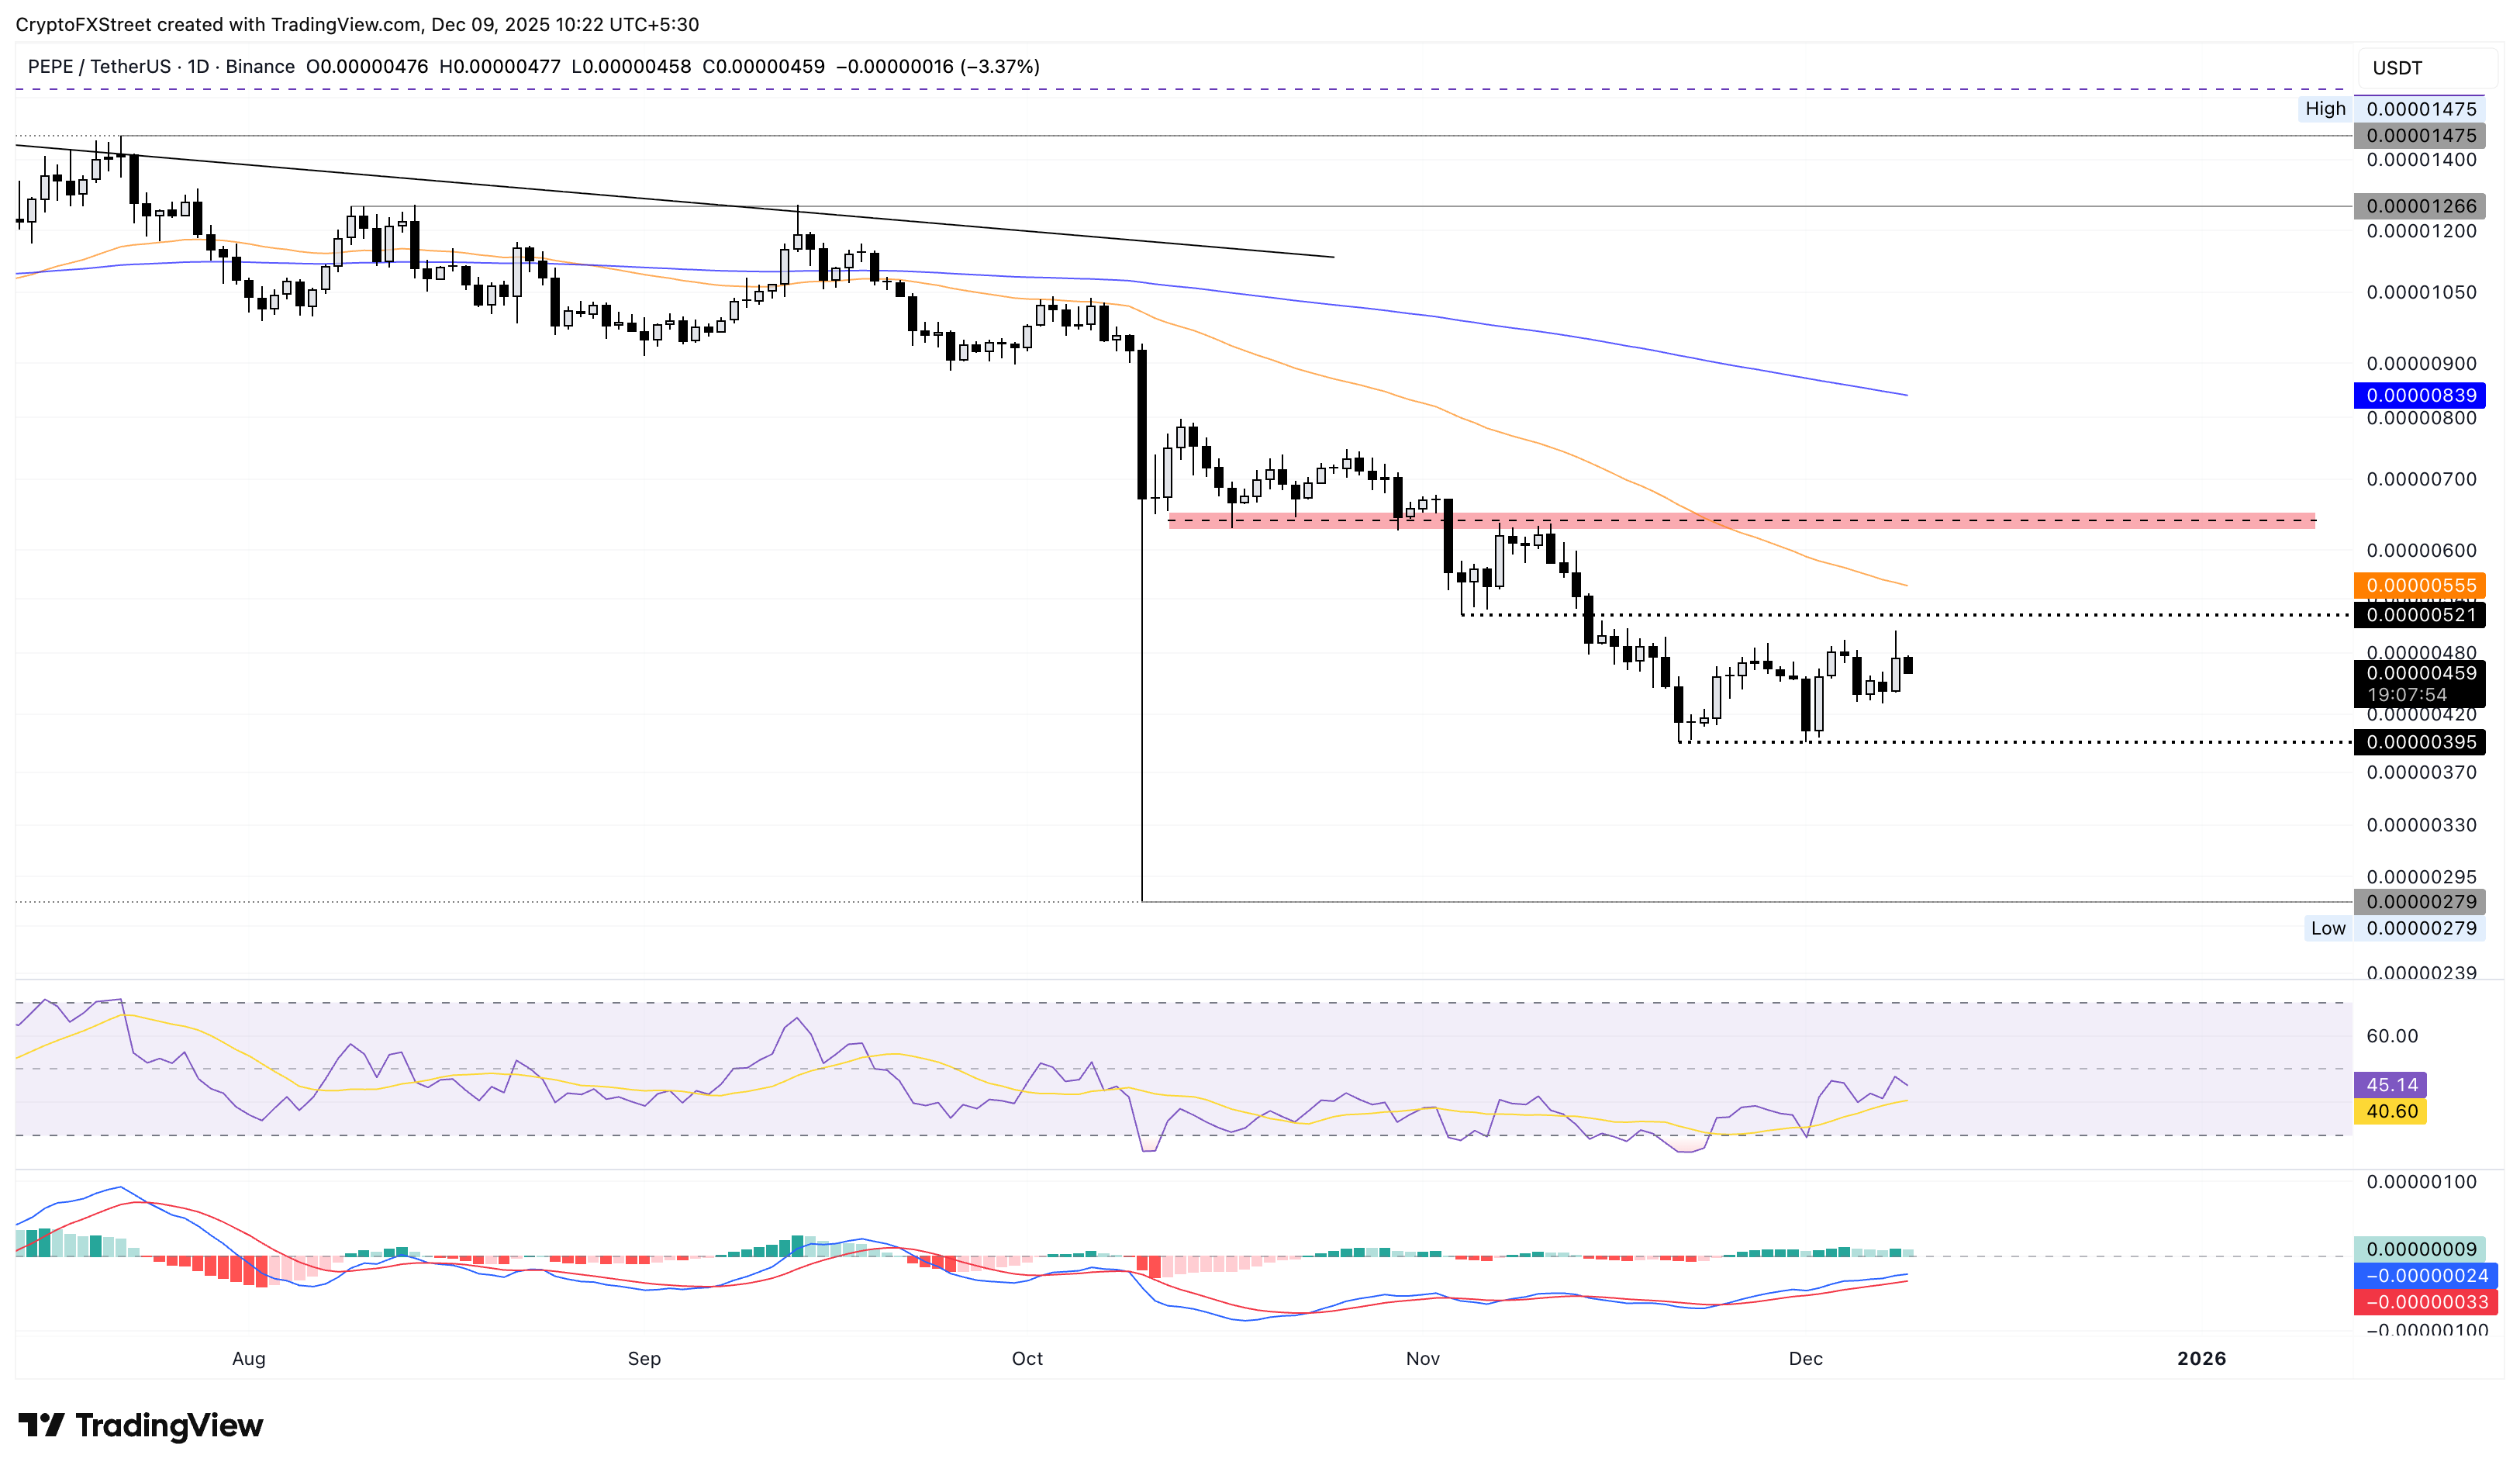
If PEPE secures a daily close above the $0.00000521 level marked by the November 4 low, it could aim for the supply present near $0.00000650, followed by the 200-day EMA at $0.00000839.

100만 명이 넘는 사용자가 FXStreet를 통해 실시간 시장 데이터, 차트 도구, 전문가 인사이트, 포렉스 뉴스를 이용합니다. 포괄적인 경제 캘린더와 교육 웨비나는 트레이더가 정보를 유지하고 신중한 결정을 내리도록 돕습니다. FXStreet는 바르셀로나 본사와 전 세계 지역에 걸쳐 약 60명의 팀으로 구성되어 있습니다.
더 읽기


